In-depth .NET Memory Profiling
Find Memory Leaks and Optimize Memory Usage in any .NET Program
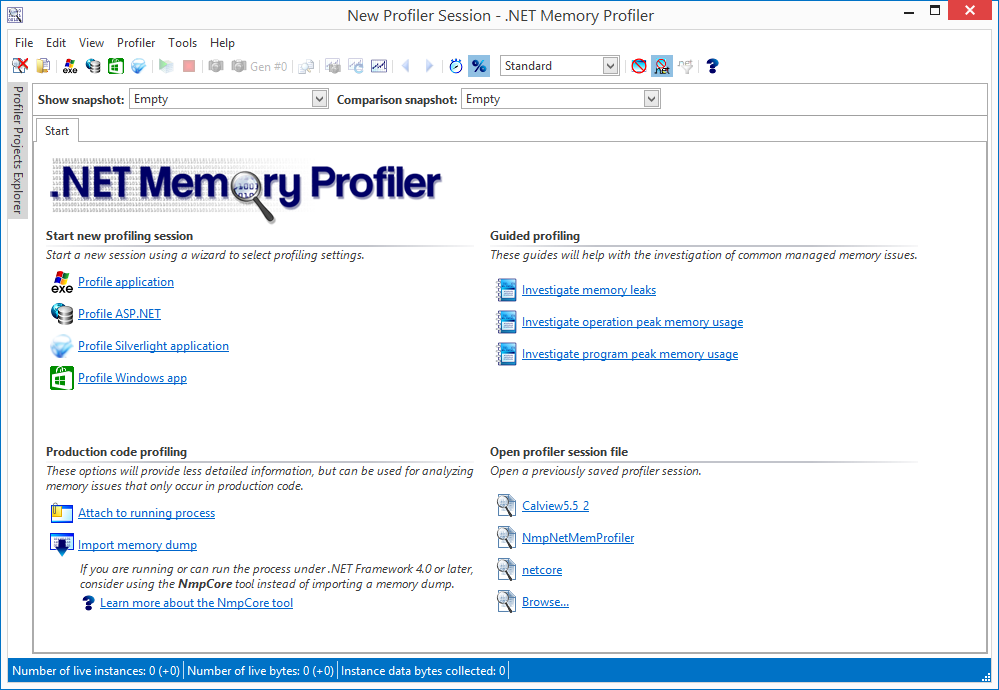
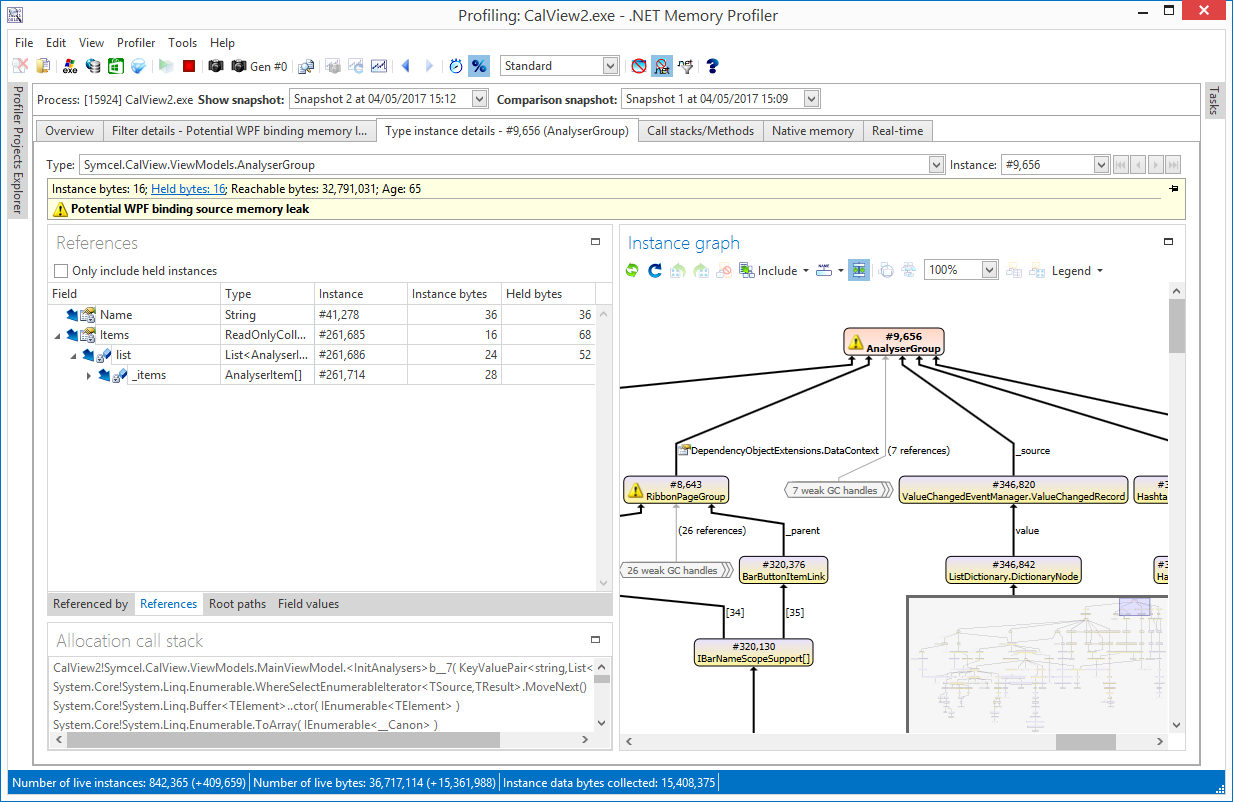
.NET Memory Profiler is a powerful tool for finding memory leaks and optimizing the memory usage in programs written in C#, VB.NET or any other .NET Language. With the help of the profiling guides, the automatic memory analyzer, and specialized trackers, you can make sure that your program has no memory or resource leaks, and that the memory usage is as optimal as possible.

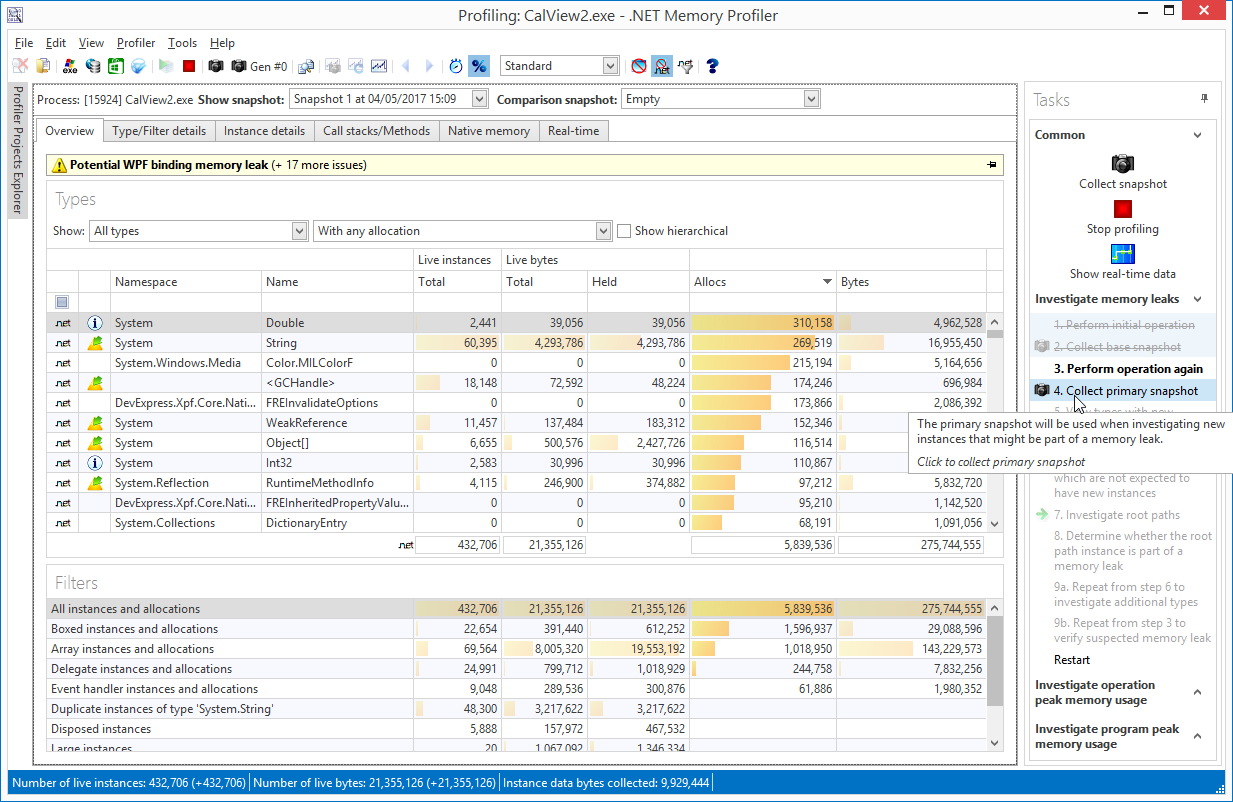
Find memory leaks
Easily identify memory leaks by collecting and comparing snapshots of .NET memory usage. A profiling guide is available to give you tips on how to detect memory leaks.

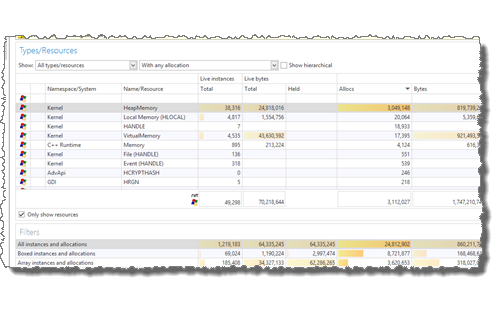
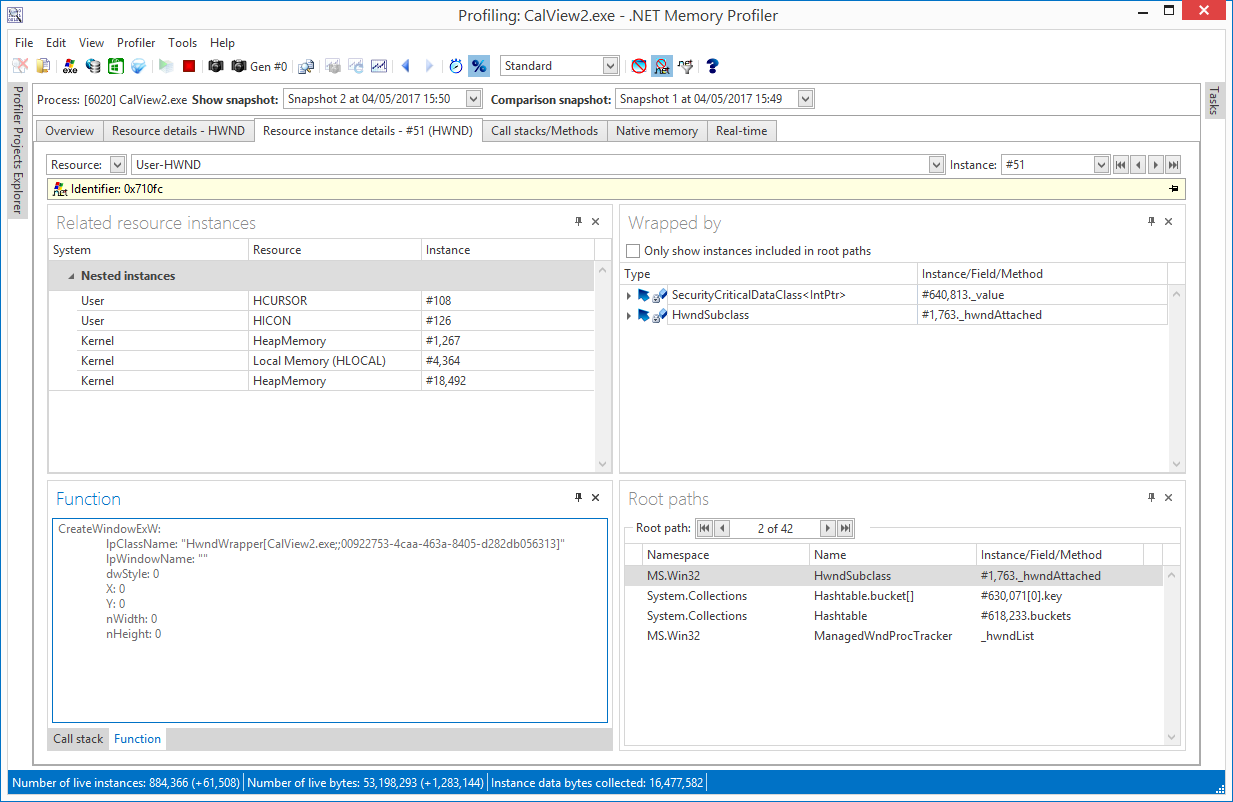
Reduce resource usage
Native resources are used in a managed .NET program as well. .NET Memory Profiler will help you make sure that there are no resource leaks and that resources are released as quickly as possible.

Excessive memory and resource usage, excessive allocations, and bad allocation patterns, will negatively affect the performance of your program. .NET Memory Profiler will provide you with the information you need to optimize memory and resource usage.

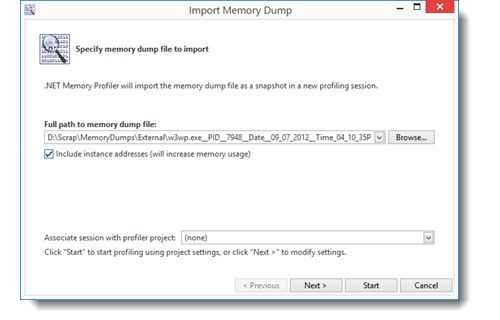
Investigate memory problems in production code
Investigate memory issues in production code with the free NmpCore tool or by importing memory dumps. The NmpCore tool allows you to profile remote processes and attach to processes on a production machine.

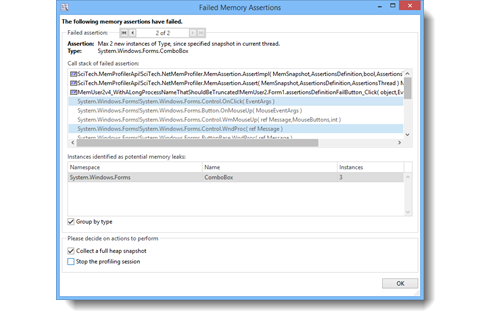
Automate memory testing
Use the .NET Memory Profiler API to automatically detect memory leaks and control the profiler from within the profiled program.

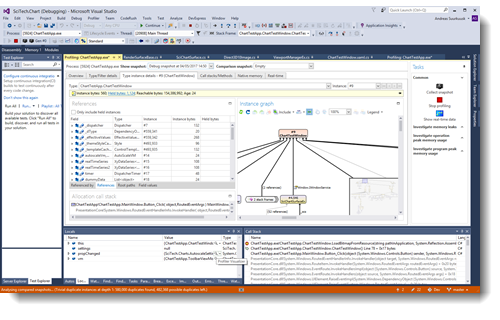
Improve your debugging experience
.NET Memory Profiler is fully integrated with Visual Studio. Investigate memory usage directly from the development enviroment and get detailed memory information while debugging.


Testimonials and Customers
Your tool has saved me so much time and effort. I can’t live without it. Doing .NET development without .NET Memory Profiler is just plain crazy!
John Robbins Wintellect
News
.NET Memory Profiler 5.7.28 Released, with support for Visual Studio 2022 (17.4) and .NET 7.0
An update of .NET Memory Profiler (v5.7.28) is now available, including support for Visual Studio 2022 (17.4) and .NET 7.0. [more]
.NET Memory Profiler 5.7.25 Released, with support for Visual Studio 2022 and .NET 6.0
An update of .NET Memory Profiler (v5.7.25) is now available, including support for Visual Studio 2022 and .NET 6.0. [more]
.NET Memory Profiler 5.7 Released
We are happy to announce that .NET Memory Profiler 5.7 is now available. [more]
.NET Memory Profiler 5.7 Beta Released
The first beta of .NET Memory Profiler 5.7 has been released and is now available for download. [more]
.NET Memory Profiler 5.6.53 Released
An update of .NET Memory Profiler (v5.6.53) is now available, including support for Visual Studio 2019 and .NET Core 3.0. [more]
Articles
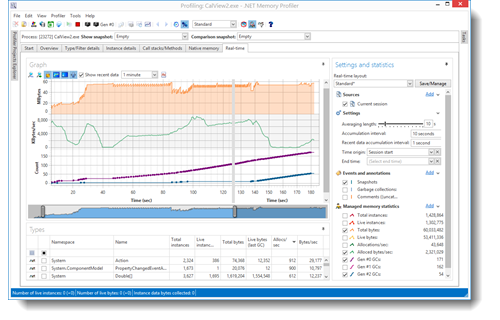
Memory Usage Optimization in Charts Library
Jun 16, 2017
When we converted the user interface of .NET Memory Profiler from Windows Forms to WPF (for the v5.0 release), we needed to replace the charting component we used for the real-time presentation. [more]
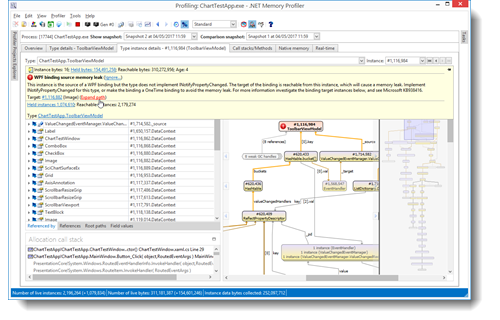
Resource leak in TreeView
When investigating memory problems reported by a user of .NET Memory Profiler (in our support forum), a resource leak was discovered. [more]
Memory profiling SQL Server
One profiling scenario that is currently not supported by .NET Memory Profiler is SQL Server profiling. If your SQL Server database contains any .NET stored procedures or any other .NET code it can be important to validate the memory usage of the .NET code, especially if any state is kept by the .NET code. [more]
The "Other data" node
A common question we get about the profiler is how the number presented under the “Other data-><Other>” node in the Native memory tree should be interpreted. This number can often be significant compared to the total memory used by the application. [more]
