This is the first part of the article "Memory Usage Optimization in Charts Library", by Andreas Suurkuusk, co-founder of SciTech Software.
The following parts are available:
- Memory Usage Optimization in Charts Library - Part 1 (this part)
- Memory Usage Optimization in Charts Library - Part 2
- Memory Usage Optimization in Charts Library - Part 3
- Memory Usage Optimization in Charts Library - Part 4
UPDATE: The source code modifications performed in this article have now been incorporated in the SciChart library (v4.2.4.10393).
We want to thank Andreas for the in-depth analysis that he has performed on the SciChart WPF Charting software. We deeply care about performance and efficiency and are pretty impressed with his expertise and how he's addressed some deep issues in our High Quality renderer plugin. We will be including these as a pull request to SciChart WPF and it should benefit our other customers as well. Thank you very much!
Dr. Andrew Burnett-Thomson Director / Tech Lead / Founder SciChart Ltd.
When we converted the user interface of .NET Memory Profiler from Windows Forms to WPF (for the v5.0 release), we needed to replace the charting component we used for the real-time presentation. The component previously used was developed by our-selves and was very old. It was originally written in C++ (using Borland C++), then converted to Visual J++, and finally converted to C# and the .NET Framework. However, even though our in-house charting component was old and lacked a lot of features, it was very fast. So we wanted the replacement component to be fast as well. For our other UI components we use the Developer Express library, but their charting component is designed for business charts rather than real-time graphs and the performance is way too slow. So we looked for alternatives and found the SciChart library, a WPF charting library that focuses on high-performance real-time charts.
The SciChart library has worked well for us, but when designing the “Show recent data” feature in version 5.5, we noticed some performance issues, mainly related to excessive memory allocations and garbage collections.
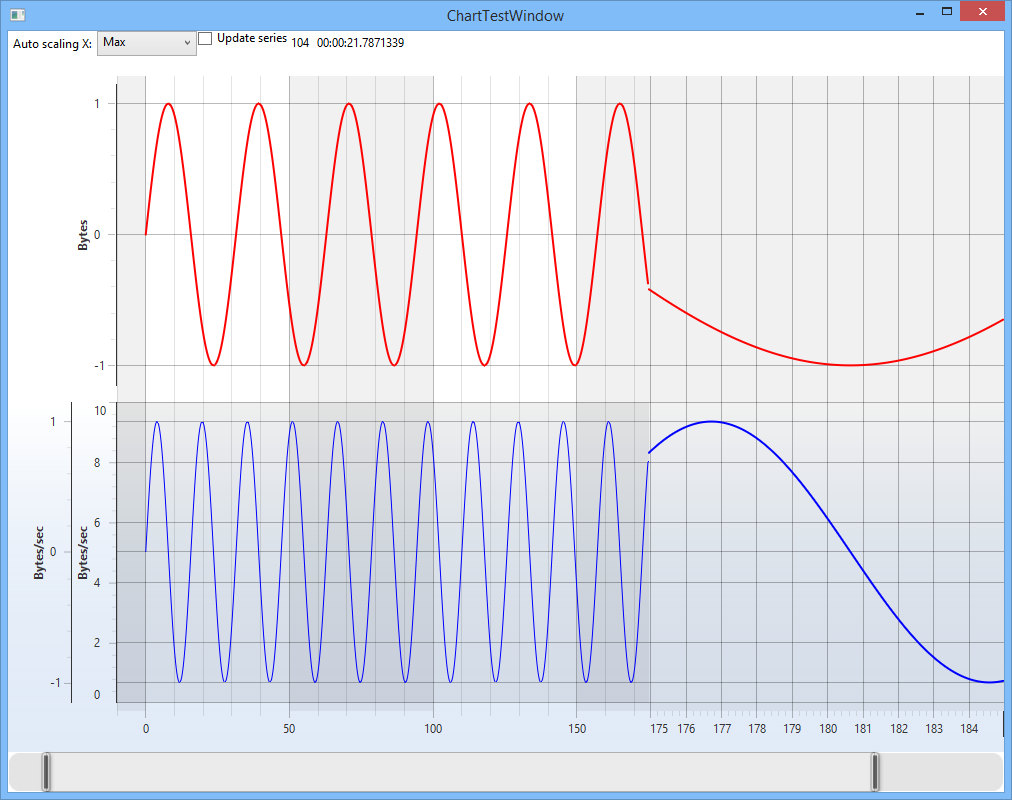
I had written a small test application which presented two sine curves on two different x-axes (see screenshot below). It was this test application that exhibited the excessive memory usage.
The SciChart library has the possibility to select between different chart renderers, e.g. a high-speed render, a high-quality render, and a DirectX renderer. In this test application I am using the high-quality renderer and, considering its name, it is not designed with performance as the highest priority. Nonetheless, it provides the opportunity to show how the memory usage can be improved using .NET Memory Profiler.
To better evaluate the memory usage of the test application, I added a small automated test, using the .NET Memory Profiler API. The test performs the following actions:
- Add some initial data to the sine curves.
- Collect a snapshot and add a real-time comment before running the test.
- Run the actual test. The test adds 3000 data points to the sine curves and renders the charts between each added data point.
- Collect a snapshot and add a real-time comment after the test.
The code below conceptually shows what the test looks like (in reality it is a bit more complicated):
private void RunSciChartTest()
{
    const int ValuesToAdd = 3000;

    this.AddInitialData();

    this.OnStarted();

    for( int i=0; i < ValuesToAdd; i++ )
    {
        this.AddSineValueAndRenderGraph();
    }

    this.OnStopped();
}

private void OnStarted()
{
    MemProfiler.FullSnapshot("Before chart updater test");
    MemProfiler.AddRealTimeComment("Starting chart updater test");
}

private void OnStopped()
{
    MemProfiler.AddRealTimeComment("Stopped chart updater test");
    MemProfiler.FullSnapshot("After chart updater test");
}
The screenshots below show the data presented by the real-time view when running this test.
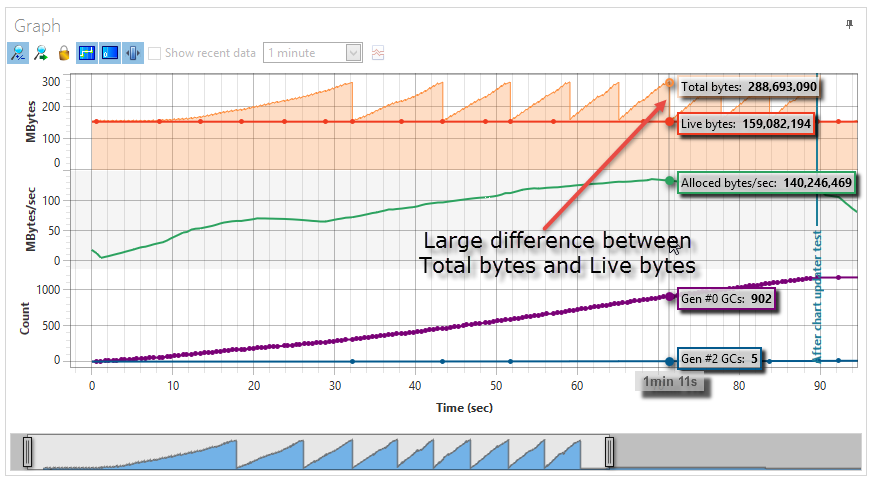
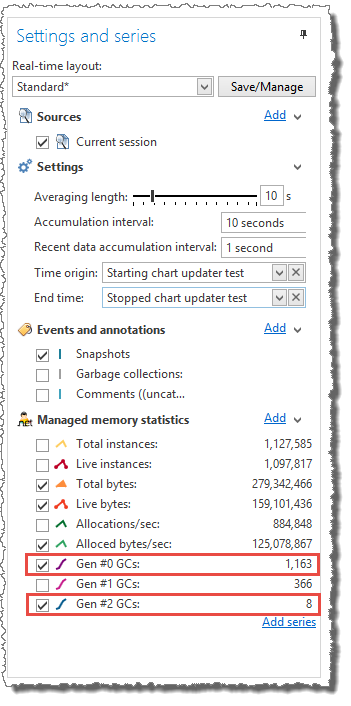
One thing that can be observed is that during the test 1,163 gen #0 garbage collections were performed. Gen #0 garbage collections are fast, but excessive garbage collections will affect the performance.
Another thing that can be observed is that the total bytes used reach about 275 MB, but the live bytes used (by reachable instances) is about 152 MB. So there is a memory overhead of over 80%. Furthermore, a full (generation #2) garbage collection had to be performed to reduce the memory usage. Generation #2 garbage collections can be slow, especially in a complex application with high memory usage.
The comparison of the two snapshots collected by the test reveals the following:
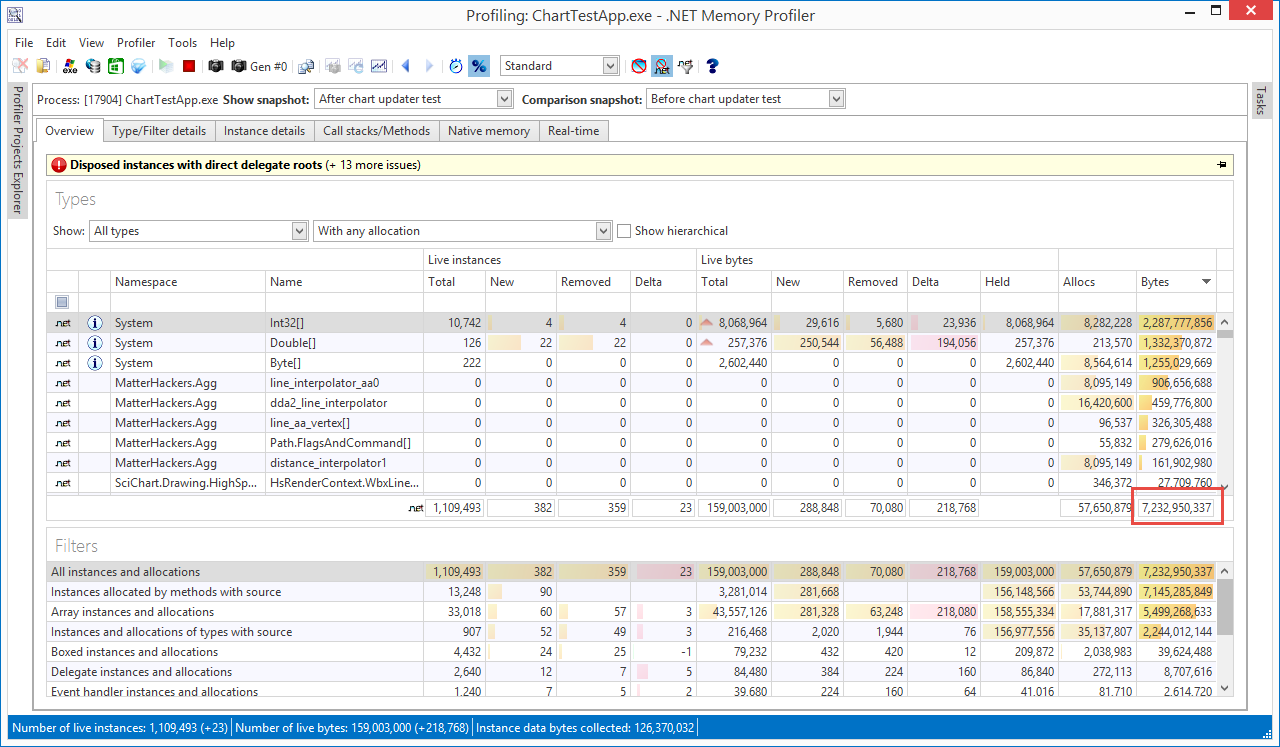
Close to 7 gigabytes of memory is allocated (and garbage collected) during the test. The types with the most allocated
bytes are Int32[], Double[], Byte[], and line_interpolator_aa0 (internal class used by SciChart).
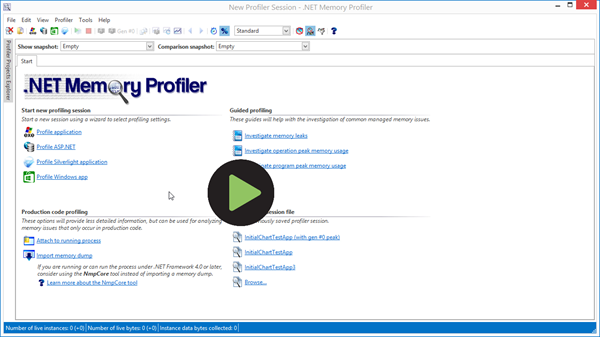
Clearly, there seems to be an opportunity for optimization here. To be able to compare the optimization progress, I save the session as “InitialChartTestApp.prfsession” and create a profiler project which includes the initial session as a comparison session in the real-time layout. To create the project, the following steps were performed:
- Create new profiler project (New profiler project)
- Select Standalone application as the project type and then select the executable of the test application.
- Finish the profiler project wizard.
- Right click on the created profiler project, select Profiler property pages and then the Real-time->Layouts page.
- Add “InitialChartTestApp.prfsession” as an additional real-time source.
- Select the comment “Starting chart updater test” as the time origin and the comment “Stopped chart updater test” as the end time. The origin time and end time will be matched with the corresponding comment time stamps in new sessions started using the project, allowing the real-time data to be compared between sessions.
- Save the layout under a new name (e.g. “Standard (with comparison)”).
- Close the property pages and save the profiler project as “ChartTestApp.prfproj”.
The screencast below shows how the project is created.
Now we have a good starting point for the memory optimizations. In part 2 of this article, I’ll start to optimize the test application.
In-depth .NET Memory Profiling
Download .NET Memory Profiler to see how it can help you find memory leaks and optimize memory usage in your application.
Download Free Trial