This is the second part of the article "Memory Usage Optimization in Charts Library", by Andreas Suurkuusk, co-founder of SciTech Software.
The following parts are available:
- Memory Usage Optimization in Charts Library - Part 1
- Memory Usage Optimization in Charts Library - Part 2 (this part)
- Memory Usage Optimization in Charts Library - Part 3
- Memory Usage Optimization in Charts Library - Part 4
In part 1 of this article I prepared the test application and created a profiler project to use when testing. Now it's time to start optimzing.
Let’s start with the high memory overhead. To investigate and optimize the memory usage, the heap utilization tracker may be used (e.g. by selecting the “high” profiling level when starting the profiling session). Unfortunately, the heap utilization tracker currently causes a significant performance overhead (this is planned to be improved in a future version). So, instead I enabled the peak snapshots tracker. The peak snapshot tracker allows snapshots to be collected at the peak memory usage.
Re-running the test with the peak snapshot tracker enabled (this can for instance by done by using the “Investigate operation peak memory usage” profiling guide) provides the following peak snapshot information:
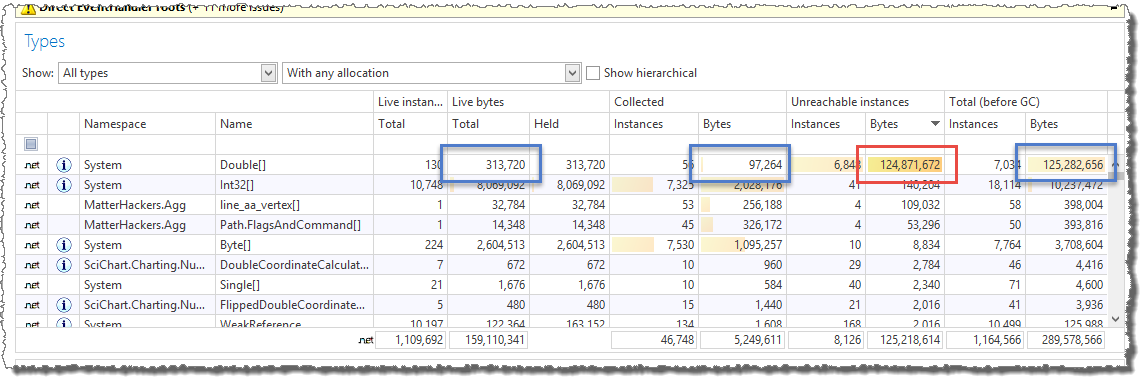
This shows that of the total 119 MB of Double[] arrays, almost all memory is used by unreachable instances.
To get more information about the unreachable bytes, I investigate the details of the Double[] array and sort the allocation stacks by “Unreachable bytes”.
This reveals the following:
The two allocation stacks that are responsible for allocating the most unreachable bytes have allocated about 119 MB of unreachable bytes, which is more or less all of the memory used by unreachable instances.
One thing that can be noticed is that the average size of the unreachable Double[] array instances is about 18 KB (or about 2,300 entries). Double[] arrays are treated
specially by the .NET runtime. Normally an instance is placed in the large object heap (LOH) if the size is 85,000 bytes or more,
but Double[] arrays are placed in the LOH if the number of entries is 1,000 or more (in a 32-bit process).
So, the Double[] array instances will be placed in the large object heap, and will not be garbage collected until a full gen #2
collection is performed. This is the reason for the high memory overhead, and the reason for the gen #2 collections performed during the test.
It would certainly be a good idea to reduce the allocations performed by the presented call stacks.
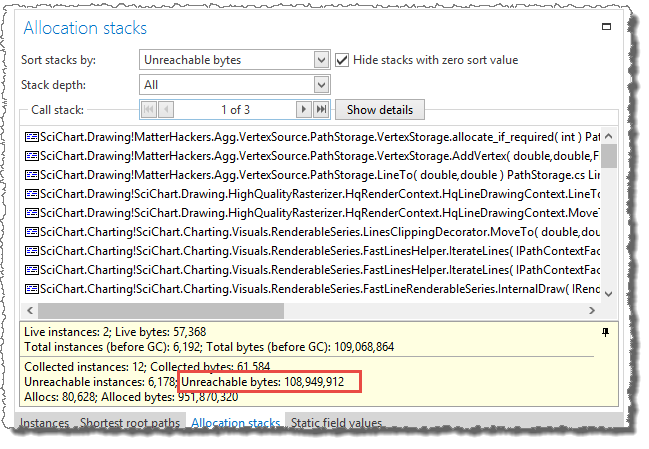
Call stack 1 (VertexStorage.allocate_if_required):
This call stack allocates Double[] arrays when data points are added to a VertexStorage by the
method HqLineDrawingContext.LineToImplementation. The VertexStorage is created by HqLineDrawingContext when individual lines
are rendered during the rendering of charts. The HqLineDrawingContext in turn is created by HqRenderContext.
The HqRenderContext and HqLineDrawingContext are internal classes used by the high quality renderer.
To optimize the allocations, I tried to re-use previously created render and drawing contexts:
Original GetRenderContext code:
public override IRenderContext2D GetRenderContext()
{
    return new HqRenderContext(...);
}
New GetRenderContext code:
public override IRenderContext2D GetRenderContext()
{
    // Try to re-use previously created (and disposed) render context.
    if (_freeRenderContext != null
        && _freeRenderContext.CanReuse(...))
    {
        var rc = _freeRenderContext;
        _freeRenderContext = null;
        rc.Init();
        return rc;
    }

    // There's no render context that can be re-used, just create a new one.
    return new HqRenderContext(...);
}

/// <summary>
/// Called by HqRenderContext when it has been disposed.
/// </summary>
/// <param name="hqRenderContext">The disposed render context.</param>
internal void RenderContextDisposed(HqRenderContext hqRenderContext)
{
    _freeRenderContext = hqRenderContext;
}
Original BeginLine code:
public sealed override IPathDrawingContext BeginLine(IPen2D pen, double startX, double startY)
{
    return new HqLineDrawingContext((HqPen)pen, this, startX, startY);
}
New BeginLine code:
public sealed override IPathDrawingContext BeginLine(IPen2D pen, double startX, double startY)
{
    HqLineDrawingContext lineDrawingContext;
    if (_freeLineDrawingContext != null && _freeLineDrawingContext.CanReuse(this))
    {
        lineDrawingContext = _freeLineDrawingContext;
        _freeLineDrawingContext = null;
        lineDrawingContext.Init((HqPen)pen, this, startX, startY);
    }
    else
    {
        lineDrawingContext = new HqLineDrawingContext((HqPen)pen, this, startX, startY);
    }

    return lineDrawingContext;
}

/// <summary>
/// Called by HqLineDrawingContext when it has been disposed.
/// </summary>
/// <param name="lineDrawingContext">The disposed line drawing context.</param>
internal void DrawingContextDisposed(HqLineDrawingContext lineDrawingContext)
{
    if (lineDrawingContext.CanReuse(this))
    {
        _freeLineDrawingContext = lineDrawingContext;
    }
}
Some additional code changes were also needed to make sure that the contexts could be correctly re-used after being disposed.
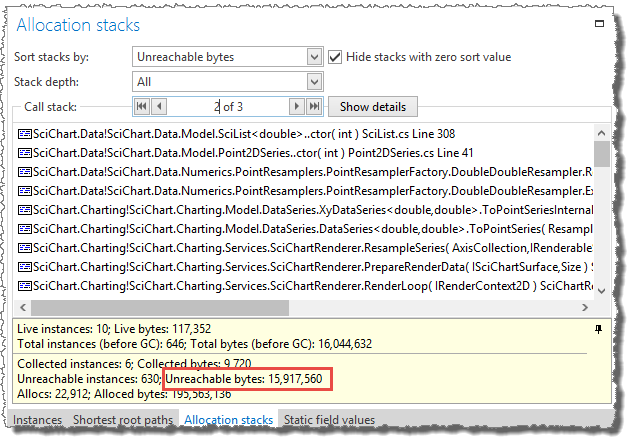
Call stack 2 (SciChart.Data.Model.SciList..ctor ):
This call stack allocates Double[] arrays during data resampling (DataSeries.ToPointSeries)
which occurs before rendering the charts. Data resampling is necessary in order to retrieve the underlying data needed for rendering,
convert it to the correct format (i.e. Double[] arrays) and possibly reduce the number of data points.
This is a highly optimized algorithm, with generated code for fast conversion between the
underlying data (e..g. Int32[], Int64[], Float[]) to the Double[] arrays needed by rendering.
The resampler tries to reuse the previously resampled data by caching the last result. If the underlying data has not changed and
the render parameters are the same (e.g. the render size), then the previously resampled data is directly re-used. If the data has changed but the render size is still the same,
the resample buffers (Double[] arrays) are re-used, to avoid additional allocations.
However, the data cache is stored in the underlying data container (DataSeries) and in this test application, each DataSeries
is used twice in the rendered charts, once for each x-axis. Since the x-axes have different ranges and different sizes,
the cached data cannot be re-used. Instead, the cached data will be recreated twice for each render pass.
I modified the code so that the cached data is associated with the chart series renderer (IRenderableSeries) instead of the
underlying data (DataSeries). To avoid too much code changes and to avoid changes to public interfaces, I used a
ConditionalWeakTable to associate the cache with the series renderer.
Even though ConditionalWeakTable is intended to be used by compilers according to the documentation,
I find it useful in cases like this, when you want to attach additional data to “external” instances.
Results and conclusion
After applying the code changes above, I ran the test application again, using the profiler project previously created.
After finishing the test, the real-time view looks like this:
![Real-time after Double[] array optimization](https://cdn.memprofiler.com/www/images/articles/Step2Graph.png)
Values presented as [1] come from the current session, and values presented as [2] come from the stored “InitialChartTestApp” session.
There are a few things that can be observed in the screenshot above:
- There’s no longer a memory overhead (or at least very little memory overhead). The total bytes value is not increasing between gen #0 garbage collections.
- No gen #2 garbage collections were performed
- The number of allocated bytes per second has decreased, but only marginally.
- The number of gen #0 garbage collections has decreased, but only marginally. There’s still a lot of gen #0 garbage collections.
The purpose of this optimization was to reduce the memory overhead and to avoid gen #2 garbage collections. Items (1) and (2) in the list above indicate that we have succeeded with this goal. Still, there are more optimizations to perform. I will continue with this in part 3 of this article.
In-depth .NET Memory Profiling
Download .NET Memory Profiler to see how it can help you find memory leaks and optimize memory usage in your application.
Download Free Trial