This is the third part of the article "Memory Usage Optimization in Charts Library", by Andreas Suurkuusk, co-founder of SciTech Software.
The following parts are available:
- Memory Usage Optimization in Charts Library - Part 1
- Memory Usage Optimization in Charts Library - Part 2
- Memory Usage Optimization in Charts Library - Part 3 (this part)
- Memory Usage Optimization in Charts Library - Part 4
In part 2 I
reduced the memory overhead of the test application by avoiding allocations of Double[] arrays.
But, even after the array optimizations, a significant amount of allocations are performed.
It is possible to use the real-time view to investigate the total number of allocations performed and bytes allocated. One way of doing this is to click on the legend for the “Allocated bytes/sec” selector and select “Accumulated from origin”. This will present an accumulated count of allocated bytes since the selected time origin.
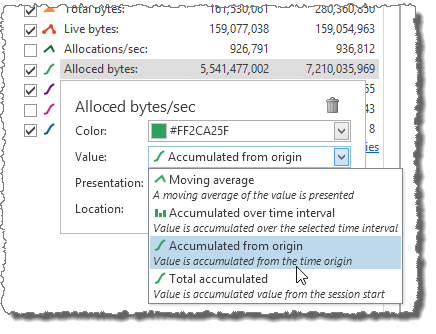
After changing from “Moving average” to “Accumulated from origin”, the following numbers are presented:
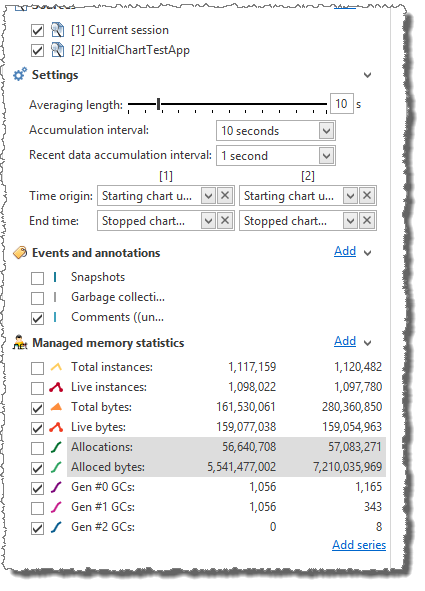
In the left column, numbers from the current session are presented and in the right column, numbers from the comparison session (“InitialChartTestApp”) are presented.
The number of allocated bytes has decreased by about 25% (from ~6,800 MB to ~5,300 MB) and the number of gen #0 garbage collections has decreased about 9%. Let’s investigate the collected snapshots to see if there are more optimizations to perform.
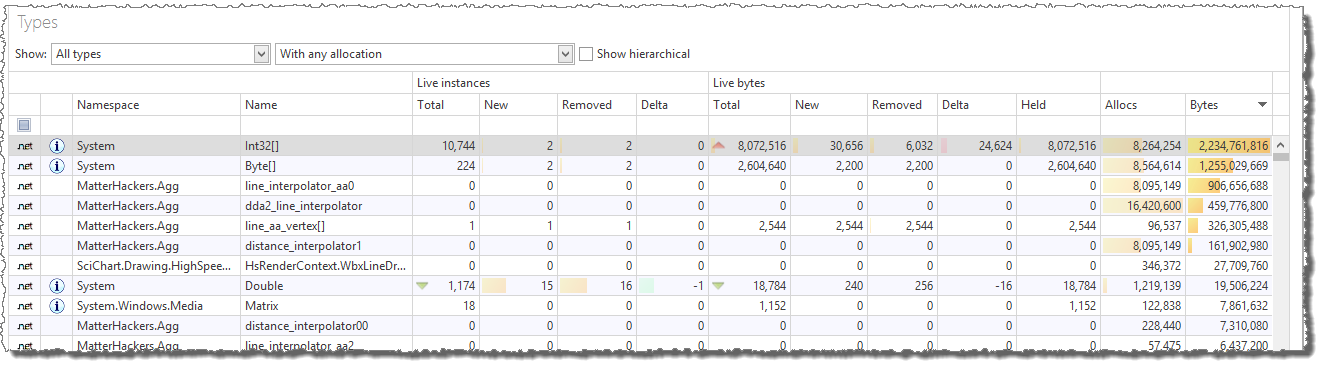
As expected, the Double[] arrays are no longer included in the top of the list when sorting by allocated bytes.
The types with the most allocated bytes are still Int32[], Byte[], line_interpolator_aa0.
The top call stacks, sorted by “Alloced bytes” are presented below:
System.Int32[]: Total allocated bytes 2,131 MB, Allocated bytes by first call stack: 2,100 MB
![System.Int32[]](https://cdn.memprofiler.com/www/images/articles/Int32AllocedBytes.png)
System.Byte[]: Total allocated bytes 1,196 MB, Allocated bytes by first call stack: 1,112 MB
![System.Byte[]](https://cdn.memprofiler.com/www/images/articles/ByteAllocedBytes.png)
line_interpolator_aa0: Total allocated bytes 865 MB, Allocated bytes by first call stack: 865 MB
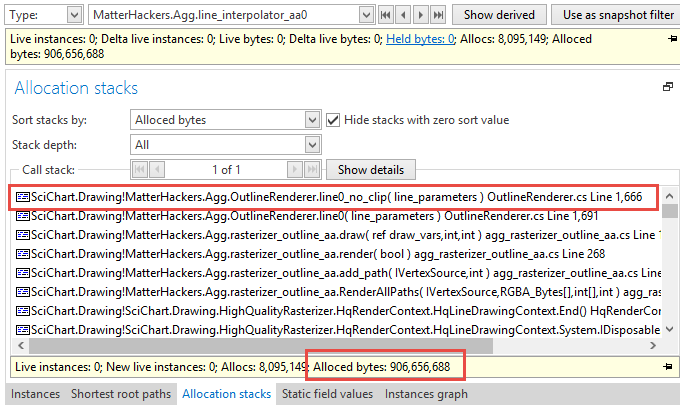
These call stacks are responsible for almost all the allocated bytes, so there’s no need to investigate further
call stacks. The common method in all call stacks is the
OutlineRender.line0_no_clip method, which allocates a line_interpolator_aa0, which in turn allocates the int[] and byte[] arrays.
Similar to the solution with excessive Double[] array allocations (in part 2), I modified the line0_no_clip method to avoid an allocation each time it is called and instead reuse a previously created instance.
Original line0_no_clip code:
public void line0_no_clip(line_parameters lp)
{
    // ...

    line_interpolator_aa0 li = new line_interpolator_aa0(this, lp);

    // ...
}
New line0_no_clip code:
public void line0_no_clip(line_parameters lp)
{
    // ...

    line_interpolator_aa0 li = _curr_line_interpolator_aa0;
    if (li == null)
    {
        _curr_line_interpolator_aa0 = li = new line_interpolator_aa0(this, lp);
    }
    else
    {
        li.init(this, lp);
    }

    // ...
}
Some additional code changes were also needed to make sure that the line_interpolators were correctly re-used.
For instance, I also needed to make sure that the OutlineRender wasn’t recreated each time a line is drawn.
Results and conclusion
After applying the necessary code changes, once again I ran the test application using the profiler project previously created.

There are a few things that can be observed in the screenshot above:
- The number of allocated bytes per second has decreased significantly.
- The number of gen #0 garbage collections has decreased significantly (160 instead of 1,165 in the initial session).
- The upper x-axis (used by the comparison session) has a longer duration, which indicates that the new test was somewhat faster.
The purpose of this optimization was to reduce the number of allocated bytes and the number of garbage collections. Items (1) and (2) in the list above indicate that we have succeeded with this goal. Still, there are more optimizations to perform. I will continue with this in part 4 of this article.
In-depth .NET Memory Profiling
Download .NET Memory Profiler to see how it can help you find memory leaks and optimize memory usage in your application.
Download Free Trial