The .NET Memory Profiler API allows you to retrieve memory usage, detect memory leaks using assertions, and control the profiler from within the profiled process.
Potential memory leaks and inefficient memory usage can be detected by retrieving memory usage information from the profiled process or by applying assertions to the code that should be tested. There are several ways of testing the memory usage and detecting memory leaks:
-
Using the
MemProfiler.GetMemoryUsagemethod. Click here for an example. -
Using the
AssertionsDefinitionclass. Click here for an example. - Using attributes to declaratively define the expected memory usage of a method. Click here for an example.
- Using the old-style memory assertions. Click here for an example.
The memory assertions examples all perform the same memory assertion, with different approaches. Even though the
AssertionsDefinition
approach is a bit more verbose, it is recommended
over the old-style assertions, since it provides much more flexibility and more
assertions, like MaxNewInstances, MaxInstances, and
MaxNewBytes
.
If the memory assertion fails, a dialog will be shown by the profiler. This dialog will present information about the failed assertion and allow you to decide on actions to perform.
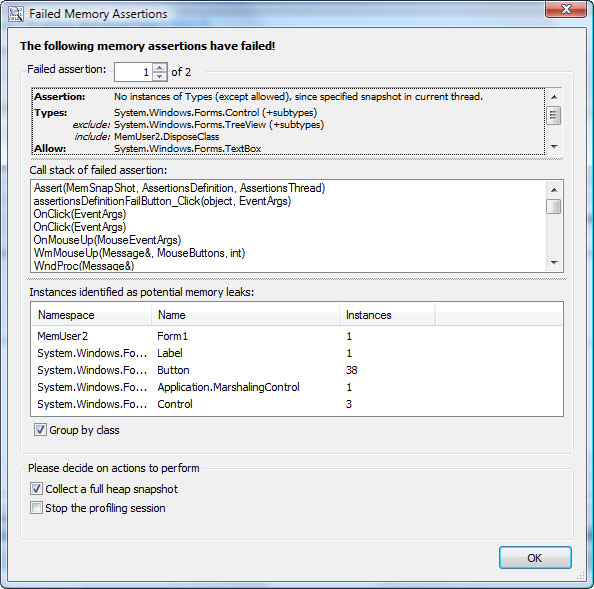
Click the image to magnify.
Retrieve memory usage of the profiled process
The code below shows how the memory usage can be retrieved:
public void TestMemoryUsage()
{
    // Collect a snapshot to use as the base when retrieving memory usage.
    var baseSnapshot = MemProfiler.FastSnapshot(true);

    //
    MethodThatShouldBeTested();

    // Retrieve information about the memory usage (live instances and allocations)
    // since the base snapshot
    var memUsage = MemProfiler.GetMemoryUsage(baseSnapshot);

    var instances = memUsage.GetLiveInstancesInfo();
    var allocs = memUsage.GetAllocationsInfo();

    Console.WriteLine("Number of new live instances: {0} (using {1} bytes)",
        instances.NewInstancesCount,
        instances.NewBytesCount );
    Console.WriteLine("Number of performed allocations: {0} ({1} bytes)",
        allocs.AllocatedInstancesCount,
        allocs.AllocatedBytesCount
    );

    // It is also possible to retrieve instances for a specific type
    var bitmapInstances = memUsage
        .GetLiveInstancesInfo( typeof( System.Drawing.Bitmap) );
    Console.WriteLine("Number of new bitmap instances: {}",
        bitmapInstances.NewInstancesCount );

    // ... or for a set of types
    var typeSetInstances = memUsage.GetLiveInstancesInfo(TypeSet.Empty
        .AddNamespace( "System.Windows" )
        .Add( typeof( System.Drawing.Image ), true) );
    Console.WriteLine(
        "Number of new instances in System.Windows namespace and derived from Image: {0}",
        bitmapInstances.NewInstancesCount);
}
The GetMemoryUsage method makes it possible to assert the memory usage in a more direct way compared to using an AssertionsDefinition (see example below). However,
instances will not be marked as potential memory leaks when asserting memory usage using the MemoryUsage class.
MemoryUsage memUsage = MemProfiler.GetMemoryUsage(baseSnapshot);
TypeSet types = ...;
var instances = memUsage.GetLiveInstancesInfo( types );
var allocs = memUsage.GetAllocationsInfo( types );

Assert.LessOrEqual(1, instances.NewInstancesCount);
Assert.LessOrEqual(10, allocs.AllocatedInstancesCount);
Detect Memory Leaks using AssertionsDefinition
The code below shows how the AssertionsDefinition class can be used
to detect whether new instances have unintentionally been created by an action.
The action in this case is to show a dialog, and that action should not result in
any new System.ComponentModel.Component instances.
void ShowSomeDialog()
{
    // Establish a base snapshot
    var snapshot = MemProfiler.FastSnapshot();
    using( SomeDialog dlg = new SomeDialog() )
    {
        dlg.ShowDialog();
    }

    // Assert that no new Component instances have been
    // created. The FastSnapshot collected at the
    // beginning of the method will be used as
    // reference. The BeginAssertionsDefinition method
    // will create a new definition and assert it when disposed.
    using( var ad = MemAssertion.BeginAssertionsDefinition(snapshot) )
    {
        ad.NoNewInstances( typeof( Component ), true );
    }
}
The AssertionsDefinition.Assert method returns a boolean value, indicating whether the
assertion was successful. This value can be used as argument to a unit testing assertion (line 12):
[Test]
void TestShowDialog()
{
    var snapshot = MemProfiler.FastSnapshot();

    ShowDialog();

    using( var ad = MemAssertion.BeginAssertionsDefinition(snapshot) )
    {
        AssertionsDefinition ad = new AssertionsDefinition();
        ad.NoNewInstances( typeof( Component ), true );

        // Explicitly calling Assert; Assert will not be called when
        // disposing the AssertionsDefinition.
        Assert.IsTrue( ad.Assert() );
    }
}
Detect Memory Leaks using Attributes
The code below shows how an assertion attribute can be used to detect whether new
instances have unintentionally been created by a method. In this example we have
method that shows a dialog and closes it. After this method has been executed, no
new instances of System.ComponentModel.Component should exist. This
is declared by applying the NoNewInstances attribute to the method.
[NoNewInstances(typeof( Component ), IncludeSubclasses = true )]
void ShowSomeDialog()
{
    using( SomeDialog dlg = new SomeDialog() )
    {
        dlg.ShowDialog();
    }
}
Detect Memory Leaks using the old-style Assertions
The code below shows how memory assertions can be used to detect whether new instances
have unintentionally been created by an action. The action in this case is to show
a dialog, and that action should not result in any new System.ComponentModel.Component
instances.
void ShowSomeDialog()
{
    // Establish a base snapshot
    var snapshot = MemProfiler.FastSnapshot();
    using( SomeDialog dlg = new SomeDialog() )
    {
        dlg.ShowDialog();
    }
    // Assert that no new Component instances have been
    // created. The FastSnapshot collected at the
    // beginning of the method will be used as
    // reference.
    MemAssertion.NoNewInstances( snapshot, typeof(Component), true );


}
All memory assertion methods return a boolean value, indicating whether the assertion was successful. This value can be used as argument to a unit testing assertion (line 7):
[Test]
void TestShowDialog()
{
    var snapshot = MemProfiler.FastSnapshot();

    ShowDialog();
    Assert.IsTrue( MemAssertion.NoNewInstances(...) );
}
Unit Testing
In order to use the .NET Memory Profiler API, the profiled process must be started by the profiler. The NMP Data Collector, the NmpCore tool, and the NmpCore build task are suitable to use when running unit tests. By using NMP Data Collector or the NmpCore tool, the profiler can run without any user interaction, allowing completely automated testing of memory leaks.
For more information see the documentation and visit the NmpCore page to download NmpCore.
NmpDataCollector
Use the new NmpDataCollector to run automated unit tests during build and optionally include profiler snapshots as test case attachments.
The NmpCore Tool
The free NmpCore tool can be used to run tests on machines where .NET Memory Profiler is not installed.
NuGet Packages
The following NuGet packages related to automated memory testing using .NET Memory Profiler are available:
- SciTech.MemProfilerApi: The .NET Memory Profiler API library, including the API classes like MemProfiler and MemAssertion.
- SciTech.NmpDataCollector: Includes the NMP Data Collector.
- SciTech.NmpCore.Task: Includes the free NmpCore tool and the NmpCore MsBuild task.
