This is the fourth part of the article "Memory Usage Optimization in Charts Library", by Andreas Suurkuusk, co-founder of SciTech Software.
The following parts are available:
- Memory Usage Optimization in Charts Library - Part 1
- Memory Usage Optimization in Charts Library - Part 2
- Memory Usage Optimization in Charts Library - Part 3
- Memory Usage Optimization in Charts Library - Part 4 (this part)
After the optimizations in part 3, the number of allocated bytes was reduced significantly (roughly a 90% decrease). However, if I change the real-time graph to show Allocations instead of Allocated bytes, the decrease is not as significant, only about 40%. This should be expected, since I have been focusing on allocations of larger instances, e.g. arrays.
The snapshot comparison of the snapshots collected in part 3 includes the following allocations information:
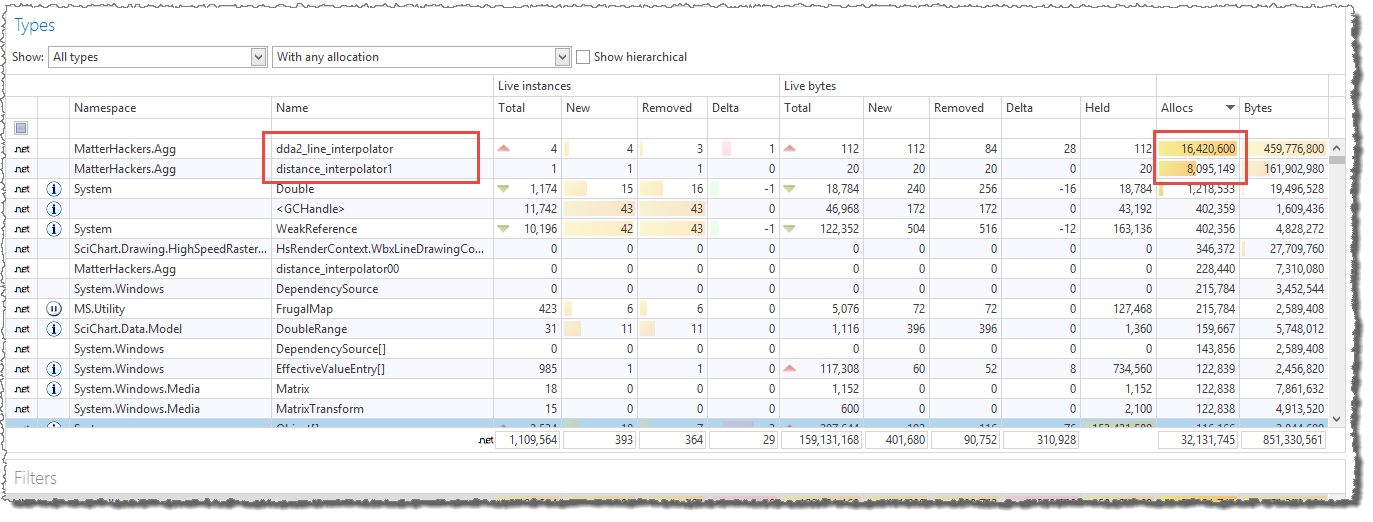
The call stacks with the most allocations include almost all allocations performed.
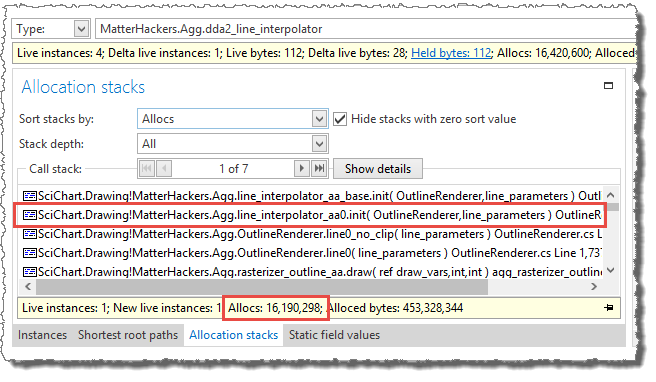
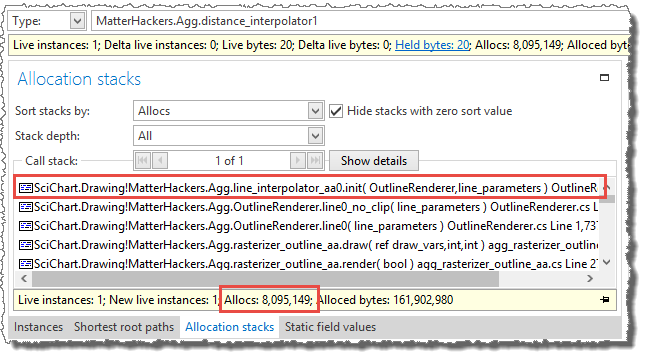
The line_interpolator_aa0.init method, which was added in part 3 to replace the line_interpolator_aa0 constructor
is responsible for creating about 24 million dda2_line_interpolator and distance_interpolator1 instances.
The dda2_line_interpolator and distance_interpolator1 classes are small helper classes used in the internal line rendering loop.
The allocations of these instance could probably be avoided by re-using a previously created instance (similar to what I did in part 2 and part 3). However, since these classes are internal classes with just a few fields, used in a tight render loop, it feels more natural to convert the classes to structs.
Original distance_interpolator1 and dda2_line_interpolator code:
internal class distance_interpolator1
{
    // Fields
    // ...
}

internal class dda2_line_interpolator
{
    // Fields
    // ...
}
New distance_interpolator1 and dda2_line_interpolator code:
internal struct distance_interpolator1
{
    // Fields
    // ...
}

internal struct dda2_line_interpolator
{
    // Fields
    // ...
}
To avoid copying the interpolator data (i.e. the fields) and to make sure that field changes are properly maintained over method calls, all methods accepting the interpolators as an argument must be changed so that the struct is passed by reference:
Original step_ver_base code:
int step_ver_base(distance_interpolator1 di)
{
    // ...
}
New step_ver_base code:
int step_ver_base(ref distance_interpolator1 di)
{
    // ...
}
After changing “class” to “struct” in two places and adding “ref” to four places (two method declarations and two method calls), I ran the test again.
The screencast below shows the final test run.
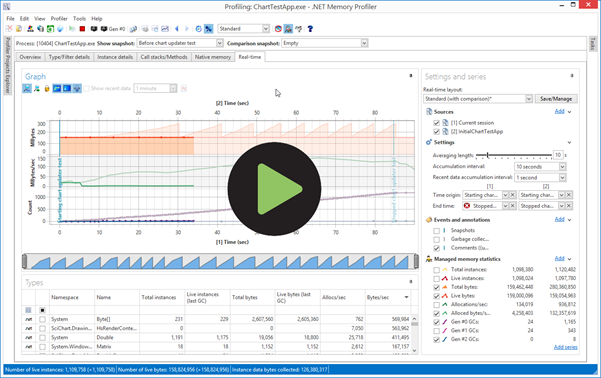
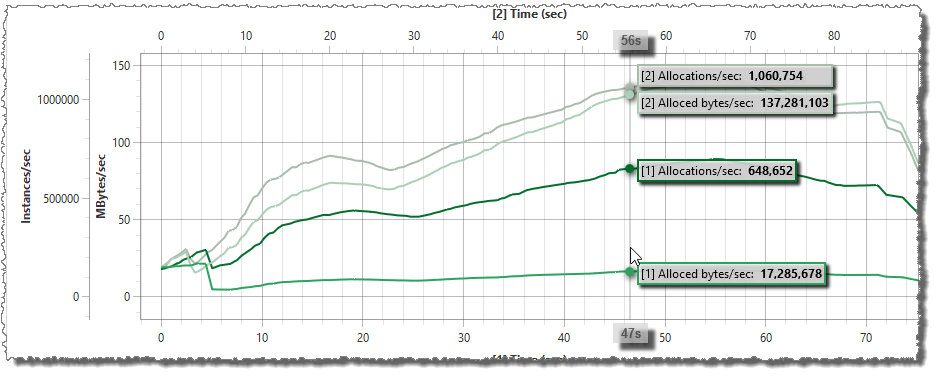
The screenshots below shows the real-time information of the initial session compared to a session with all modifications in part 2, 3, and 4.
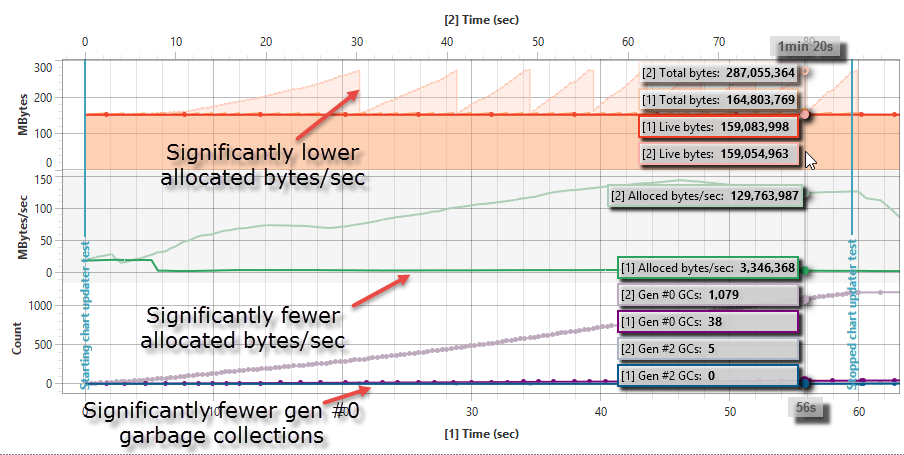

After performing all optimizations in this article, the following final results can be observed:
- There’s no longer a memory overhead (or at least very little memory overhead). The total bytes value is not increasing between gen #0 garbage collections.
- No gen #2 garbage collections were performed.
- The number of allocated bytes has decreased significantly (by about 97%).
- The number of gen #0 garbage collections has decreased significantly (by about 96%).
- The upper x-axis (used by the comparison session) has a longer duration, which indicates that the test application has become faster (about 30% faster).
Performance improvements
As mentioned in item (5), the performance is about 30% faster. However, this is based on the time the test took while running under the profiler. The profiler adds a significant performance overhead to memory allocations and the garbage collector, so reducing the number of allocations will improve the performance more when running under the profiler compared to running the same program without the profiler.
The performance improvement is about 9% when running outside the profiler using a release build. To be honest, this is a smaller improvement than I expected and hoped. However, this timing includes the full rendering of the chart, including things like render surface creation, axis scaling and axis rendering. To make the line rendering more prominent in the performance test, I modified a few parameters. When including 10 line charts instead of 2, and increasing the line width from 2 pixels to 4 pixels (see screenshot), the performance improvement is about 17%.

I think 17% is a decent performance improvement, especially since no algorithm changes have been made. The only changes made are removal of allocations. The actual amount of instance initialization and data handling is about the same. Constructors have been replaced by initialization methods of previously allocated instances.
What’s more important - the number of garbage collections have decreased considerably. The application in this article is a simple test application. All allocations are performed in a single thread and all allocated instances have about the same life-time. In a more complex application (e.g. .NET Memory Profiler itself), different threads will perform different tasks, and allocate instances with different life-times. When instances have different life-times they are more likely to get promoted to a higher generation. Once an instance is promoted to generation #2 and becomes unreachable, the memory overhead will be higher and eventually a gen #2 garbage collection has to be performed to reclaim the memory.
I believe it’s always important to avoid unnecessary memory allocations in order to improve performance and memory utilization.
The main optimizations performed in this article are related to the high-quality renderer of the SciChart library, which focuses on the quality of the output rather than performance. Still, we have contacted the authors of the SciChart library and informed them about the optimizations and we have prepared pull requests for them so that they may include the modifications in their library. They will investigate the optimizations and hopefully incorporate them in a future release.
We want to thank Andreas for the in-depth analysis that he has performed on the SciChart WPF Charting software. We deeply care about performance and efficiency and are pretty impressed with his expertise and how he's addressed some deep issues in our High Quality renderer plugin. We will be including these as a pull request to SciChart WPF and it should benefit our other customers as well. Thank you very much!
Dr. Andrew Burnett-Thomson Director / Tech Lead / Founder SciChart Ltd.
In-depth .NET Memory Profiling
Download .NET Memory Profiler to see how it can help you find memory leaks and optimize memory usage in your application.
Download Free Trial