Graph
In the graph pane, graphs of selected data series are presented. Initially, total and live managed bytes and vertical markers for each collected snapshot are presented.
The graph always contains at least one x-axis, representing the time elapsed since starting the profiler session. Additionally, it contains zero or more y-axes, which are added when plots are added to the graph. When a plot is added, it must have a y-axis matching its unit. If no matching y-axis exists, a new one is added. For example, adding “Total instances” to an empty graph will add a y-axis with the text “Instances.” Adding “Live instances” to the same graph will not cause another y-axis to be added, since both “Total instances” and “Live instances” are using the unit “Instances.” However, adding “Total bytes,” will cause a y-axis with the text “Bytes” to be added.
To select which graphs to include in the graph view, the check boxes in the Settings and series panel should be used.
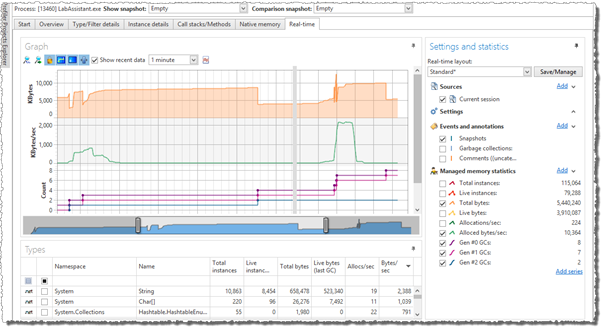
The colored legend in the Settings and series pane indicates the color and type of the graph when the series is included in the graph view. For more information on working with the graph, see Working with the Graph. For more information about the Settings and statistics pane, see Settings and Series.