Settings and Series
The Settings and series pane is used to define how real-time data is presented, which data series to include, and to present numerical values from the included real-time data.
The panes include a layout selector, and a set of collapsible groups (Sources, Settings, and real-time series categories).
Real-time layout
The real-time layout drop-down list is used to select the layout to use when presenting real-time data. The layout defines which data sources to use (i.e. session files), presentation settings, which data series to include, and how data should be presented in the real-time graph. A single layout (“Standard”) is included with the installation of .NET Memory Profiler. This layout includes the most important real-time information for the .NET runtime and native resources (if native resource tracking is enabled). Additional real-time series can be added using the “Add” and “Add series” links.
The Save/Manage button is used to show a drop-down dialog where real-time layouts can be managed.
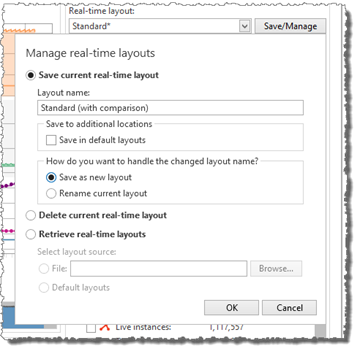
The Manage real-time layouts drop-down provides the following options:
Save current real-time layout
This option allows the user to save a modified layout, or save a layout under a different name. If the Layout name is changed, an additional option is provided, to allow the layout to be saved as a new layout (Save new layout), or to rename the current layout (Rename current layout).
It is also possible to save the layout as a default layout, to be used in all new profiler sessions, or to save it to the profiler project associated with the session (if any). The options under Save to additional locations can be used to define where the layout should be saved (Save in default layouts, Save in project).
Delete current real-time layout
This option deletes the currently selected layout from the available layouts in the session.
Retrieve real-time layouts
The Retrieve real-time layouts option provides the possibility to import real-time layout from another session, profiler project, or the default layouts.
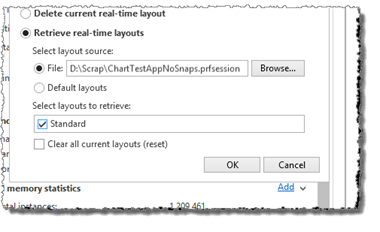
Once the layout source has been selected, a list with available layouts to import is presented. If the Clear all current layouts (reset) option is selected, all layouts in the current session are removed before importing the selected layouts.
Sources
The Sources group is used to define the sources used for the real-time data. By default, the current session is used as the real-time source, but it is possible to add external session files as additional sources.
An additional source is added using the Add link on the right hands side of Sources. The will show the Add/Modify source drop-down dialog. (Enterprise only)
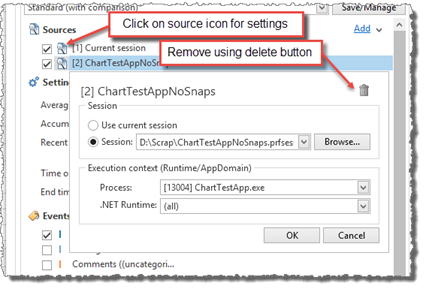
Session
Under Session the session to use as source is selected. It can be the current profiler session, or an external session file (selected using the Browse button).
Execution context
The Execution context settings can be used to define from which execution context the real-time data should be retrieved (i.e. process, runtime, or AppDomain). For the current session, this is by default the same execution context as the current snapshot selection.
Note
(Enterprise only)
By adding the same session more than once and then using the execution context, it is for instance possible to present separate real-time graphs for separate processes or runtimes in the same session.
Settings
The Settings group is used to define settings for the real-time graphs and real-time series values. It includes the following settings:
Averaging length
Defines the length of the averaging window, in seconds. This setting is used for series where the value is calculated as moving average.
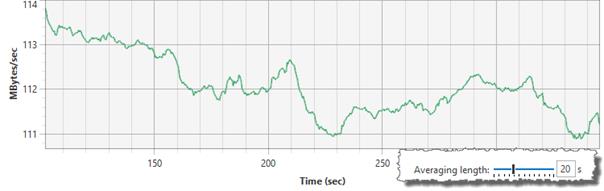
When Moving average is selected as the value for a real-time series (and graph), an averaging window is used to calculate the value. If the averaging window is short (e.g. one second), this can cause the graph to be a bit noisy, as can be seen in the screenshot below.
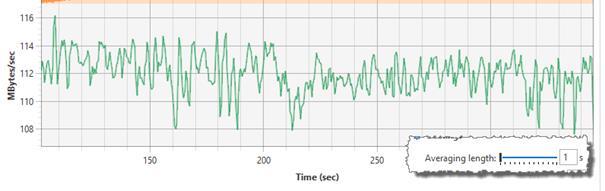
The Averaging length slider can be used to increase the size of the averaging window. This will reduce the noise in the graph and can make the graph easier to interpret.
Accumulation interval
Defines the accumulation interval length, in seconds. This setting is used for series where the value is accumulated over a time interval.
Recent data accumulation interval
Same settings as the Accumulation interval, but this setting is used for the recent data graphs.
Time origin
The Time origin field is used to select the time origin of the graphs. This is especially useful if more than one source is included in the real-time layout. The drop-down list is populated with the session start time, and with the time markers from comments added using the .NET Memory Profiler API.
Note
Currently the profiler only uses comments added by the API as time markers. This will be extended in future versions of the profiler.
By selecting matching time markers in multiple sources, the real-time graphs will be aligned, and it will be easier to compare real-time data from the source sessions.
End time
In addition to the time origin, it is also possible to specify the end time of the real-time graph. If both the origin time and the end time are specified for a source, the corresponding x-axis will be locked for the time range. If multiple sources are used and the end times are specified, then multiple x-axes will be included in the graph, one for each source. This way it will be possible to compare the memory usage behavior of an operation between separate sessions, for instance to see how well an optimization works.
Real-time series
Below the graph settings, the included real-time series are presented, grouped by the series category. Currently the following categories are available:
 Events and annotations
The events and annotations category include real-time events, such as snapshot collection, garbage collections, and comments added using the profiler API. Managed memory statistics
This category includes statistics of the memory usage and garbage collections of the .NET runtime. For more information about the information presented, see Managed memory statistics. Native resources statistics
This category includes statistics of the total resource usage of the selected processes. For more information about the information presented, see Native resources statistics.- Types
This category includes memory usage information for specific types. To make a type available as a real-time series and to include real-time type information in the graph, it must be marked for real-time collection using the Types/Resources real-time view. The real-time data available includes allocation and instances information for the type. For more information about the information presented, see [Managed memory statistics]((#managed-memory-statistics). - Resources
This category includes resource usage information for specific resources. To make a resource available as a real-time series and to include real-time resource information in the graph, it must be marked for real-time collection using the real-time Types/Resources view. The real-time data available includes allocation and instances information for the resource. For more information, see Native resources statistics.  Performance counters (one per performance counter category) (Enterprise only)
If performance counters are added to the layout, a category group will be created for each performance counter category. New performance counter categories are added using the “Add series” link (see below).
Within each category, the real-time series are presented. Each real-time series is includes:
A checkbox to include/exclude the series from the graph
A legend icon, which indicates how the series will be presented in the graph, and acts as a button for series settings.
Name of the series
The value(s) of the series; either the last collected value, or the value at the time selected using the time selector. One value is presented for each included source.
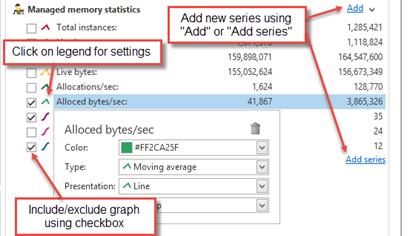
New series are added using the “Add” link (in the series category header), or by using the “Add series” link below the series categories. The “Add” link is used to an additional series in the same category. The “Add series” link can be used to add series to a new category.
Managed memory statistics
The following real-time data is available under the Managed memory statistics category:
Note
Several of the values will be updated only after a garbage collect. These values are marked with an ‘*.’
Total instances
This is the total number of instances in the managed heap, which includes both instances that are reachable and instances that cannot be reached.Live instances*
This is the number of live instances at the last GC.Total bytes
This number shows the total number of bytes used by all the instances in the managed heap, including both instances that are reachable and instances that cannot be reached.Live bytes*
This number shows the number of bytes used by the instances that were reachable at the last GC.Allocs/sec
This number shows the number of allocations performed per second. It can be presented as a moving average, or be accumulated, either over a time interval or since a specified start time.Bytes/sec
This number shows the number of bytes allocated per second. It can be presented as a moving average, or be accumulated, either over a time interval or since a specified start time.Disposed instances*
This number shows the number of instances that have been disposed but that have not yet been garbage collected.Undisposed instances*
This number shows the number of instances of disposable classes that have been garbage collected without being properly disposed.Gen #0 GCs*
This number shows the number of generation #0 garbage collects that have been performed.Gen #1 GCs*
This number shows the number of generation #1 garbage collects that have been performed.Gen #2 GCs*
This number shows the number of generation #2 garbage collects that have been performed.Root references*
This number shows the number of root references that existed at the time of the last GC.Non-null root references*
This number shows how many of the root references were not null at the time of the last GC.Instance references*
This number shows how many references between instances that existed at the time of the last GC.Bytes moved*
This number shows how many bytes were moved when the memory was compacted during the last GC.
Native resources statistics
The following numbers are presented under the native resources category:
Total instances
This is the total number of native resource instances that exists in the process (as tracked by the resource tracker).Total bytes
This number shows the total number of bytes used by all the resource instances in the process (as tracker by the resource tracker).Allocs/sec
This number shows the number of resource instance allocations performed per second. It can be presented as a moving average, or be accumulated, either over a time interval or since a specified start time.Bytes/sec
This number shows the number of bytes allocated by native resource instances per second. It can be presented as a moving average, or be accumulated, either over a time interval or since a specified start time.