Working with the Graph
To control the scaling of the axes and the appearance of plots, a set of commands and an axis scroll bar are provided. A data reader is also provided to facilitate reading data values in the graph.
Commands
| Command | Description | |
|---|---|---|
 |
Scale to Show All | When checked, the x-axis is scaled to include all available data. |
 |
Autoscale Right Side X | When checked, the x-axis is scaled to include the time of the last data point. The left side of the x-axis is not automatically modified. This has the effect of condensing the contents of the graph whenever new data are added. |
 |
Lock X-axis Range | When checked, the x-axis is scaled to include the time of the last data point without modifying the length of the x-axis. This has the effect of scrolling the contents of the graph whenever new data are added. |
 |
Connect GC Data | When checked, data that are collected only at garbage collects is connected with lines. If the command is not checked, GC data are shown only as small circles. |
 |
Include Zero | When checked, the y-axes are scaled to include both zero and the highest value of the plots. If the command is not checked, the y-axes are scaled only to show the lowest and the highest values of the plot. |
 |
Show time selector | When checked, the time selector is shown in the graph when moving the mouse over the graph. For more information, see Session Time Selector. |
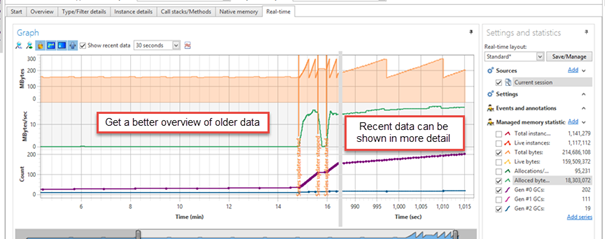
| Show recent data | When checked, recent real-time data is shown in more details on the right side of the graph. For more information, see Recent data graph. | |
 |
Use separate scale for recent data | When checked, the recent data uses a separate y-axis, to allow more detailed information to be presented for the recent data. If not checked, recent data and “old” data uses the same scaling. |
Axis Overview Bar
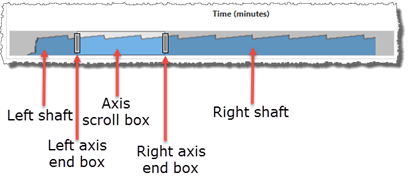
The axis overview bar gives you an overview of the collected real-time data and allows you to manually select the x-axis range of the graph. Below is an explanation of the different parts:
Left shaft
Clicking this part will scroll the x-axis one “page” to the left. All autoscaling of the x-axis will be stopped when scrolling the axis.Left axis end box
Dragging this part will change the position of the left side of the x-axis. If the axis scaling is set to “Scale to show all” before dragging this box, the axis scaling will be changed to “Autoscale Right Side X.”Axis scroll box
Dragging this part will scroll the entire x-axis to the left or to the right. All autoscaling of the x-axis will be stopped when dragging the scroll box.Right axis end box
Dragging this part will change the position of the right side of the x-axis. All autoscaling of the x-axis will be stopped when dragging this box.Right shaft
Clicking this part will scroll the x-axis one “page” to the right. All autoscaling of the x-axis will be stopped when scrolling the axis.
Data Reader
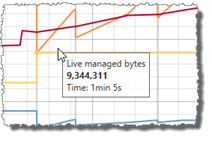
The data reader can be used to read the value at a specific location of a plot. The data reader is enabled when the time selector is disabled. Simply move the mouse over a plot to read the value of the plot. When the cursor is close enough to a plot, a tooltip window will appear, showing the name of the plot and the X- (time) and Y-value of the plot at the location of the cursor.
Recent data graph
Recent data can be shown in more detail by selecting the "Show recent data" option in the Graph toolbar. When this option is enabled, the graph is divided into two horizontal parts. The right side of the graph presents the most recent real-time data, and the left side presents older data. The length of the recent data part is specified using the drop-down list to the left of the “Show recent data” checkbox.