The .NET Memory Profiler Window
The .NET Memory Profiler window contains a menu, a toolbar, a status bar, and one or more session documents.
The menu and the toolbar provide access to all the available commands.
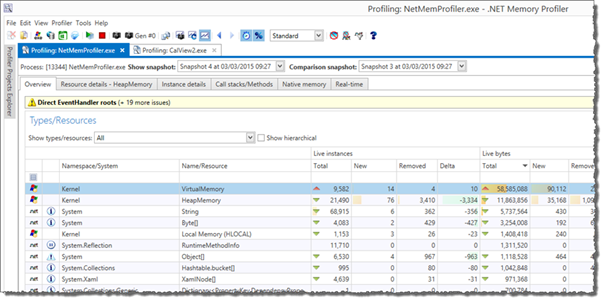
Each session document includes a process and snapshot selector at the top and a set of tab pages. The tab pages are used to present different views of the contents of the GC heap, both snapshot information and real-time information. Additionally, information about call stacks and native memory is presented. The available tab pages are:
Start
The Start page provides quick access to common tasks, such as starting a profiling session, starting guided profiling, and opening a previous session file. It will be hidden as soon as an active session is started or a session is loaded. Use the New session command to get back to the Start page.Overview (For more information, see Overview Page.)
Type/Resource/Filter details (For more information, see Type/Filter/Resource Details Page.)
Instance details (For more information, see Instance Details Page.)
Call stacks/methods (For more information, see Call Stacks/Methods Page.)
Native memory (For more information, see Native Memory Page.)
Real-time (For more information, see Real-Time Page.)
Additionally, a Tasks tool window is available when there is an active profiling session. The Tasks window provides access to the profiling guides and common profiling commands. For more information, see Guided Profiling and the Tasks Window.
Note
Multiple session documents are only available in the Enterprise edition. In the Professional and Standard edition it is only possible to work with one session at the time.