Guided Profiling and the Tasks Window
On the Start page, a set of profiling guides are available. The profiling guides provide interactive step-by-step instructions that will help you with common memory profiling tasks, such as memory leak investigations.
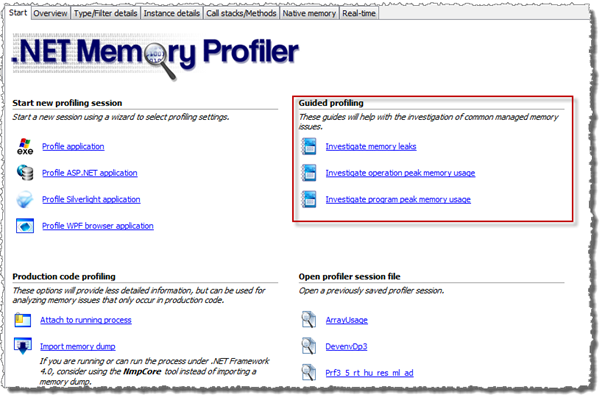
Use the Investigate… links to start profiling with the help of a guide. This will open the start guide wizard that allows the process to profile to be selected. The start guide wizard will not give access to other session settings, unlike the other start profiling wizards, since the guide will initialize the appropriate settings.
Once the profiling has started, the step-by-step instructions are presented in the Tasks window (normally to the right).
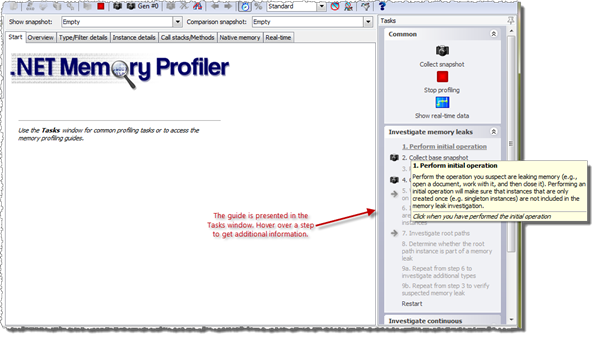
Even though the guides are designed to be stepped through sequentially, it is often possible to skip or repeat some steps. The next recommended step is highlighted using bold, steps that are not available are grayed out. A tool tip window is used to provide additional information about the step.
A step might require user interaction (e.g. with the profiled process); in this case the step should be clicked to inform the guide that the interaction has been performed. In other cases clicking the step will actually perform a profiler action (e.g. Collect base snapshot). The info window of the step will tell the actual meaning of clicking the step.