Profiling Level Settings Page
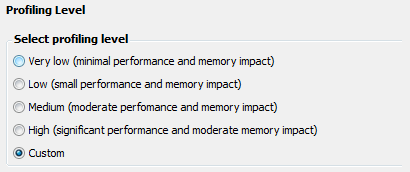
The profiling levels are used to easily define session setting, based on the amount of information to collect from the profiled application versus the performance of the profiler. The Medium profiling provides a good balance between the amount of data collected and the performance impact of the profiler. When profiling a very complex and memory consuming application, the Low or Very low level might be more appropriate, as the memory and performance overhead is much lower. To get full memory information, including heap utilization, use the High level.
The profiling level is actually not a session setting itself, changing the profiling level will just initialize a set of other session settings, namely: Instance tracking level, Enable dispose tracker, Collect allocation call stacks, Collect real-time data, Enable heap utilization tracking, and Disable inlining. For more information about these settings, see Instance Tracking Settings Page and General Settings Page.
The following levels are available:
Very low
No instance tracking, no dispose tracker, no allocation call stacks collection, no real-time date, no heap utilization, inlining not disabled.Low
Limited instance tracking, no dispose tracker, limited allocation call stacks collection (no instance specific call stacks), limited real-time data (no total instances information, just allocs/sec and live instances information), no heap utilization.Medium
Full instance tracking, dispose tracker enabled, full allocation call stack information, real-time data collection, no heap utilization.High
Full instance tracking, dispose tracker enabled, full allocation call stack information, real-time data collection, heap utilization tracking enabled.