General Settings Page
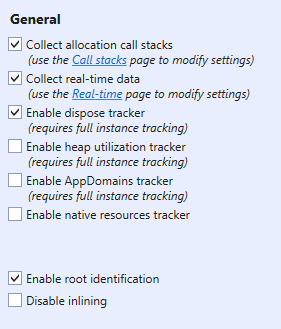
Collect allocation call stacks
This setting enables allocation call stack collection. Allocation call stacks provide essential information, so unless there is a specific reason, such as performance or memory problems; it is recommended that allocation call stacks are collected.
Additional call stacks settings are available under the Call stacks page. For more information, see Call Stacks Settings Page.
Collect real-time data
This setting allows real-time collection to be enabled. If real-time collection is enabled, the Real-time page on the main form will become available, and managed memory information will be presented in real time on that page. If real-time collection is not enabled, the Real-time page will be hidden.
Additional real-time data settings are available under the Real-time page. For more information, see Real-time Settings Page.
Enable dispose tracker
This setting enables the dispose tracker, which allows information about disposable instances to be collected. Code will be injected in certain methods to allow the instances to be tracked. However, the performance penalty is very low and no additional memory is used, so it is recommended that the dispose tracker is enabled.
Note
The dispose tracker cannot be enabled unless full instance tracking is enabled.
For more information about the dispose tracker, see Dispose Tracker.
Enable heap utilization tracking
This setting allows heap utilization tracking to be enabled. Enabling heap utilization tracking will cause information about how the generational and large object heaps are used by the allocated instances. For more information, see Heap Utilization Tracker.
Enable AppDomains tracker
This setting determines whether the AppDomains tracker should be enabled. For more information, see AppDomains Tracker.
Enable native resources tracker
(Professional and Enterprise only)
If this option is checked, then the native resource tracker will be enabled, and information about native resources will be presented in the snapshot views and the real-time view.
For more information about the native resources tracker, see Native Resources Tracker.
Enable root identification
This setting enables identification of root referrers, e.g., static fields, local variables, and method arguments that reference instances. By identifying root referrers, the profiler can present the exact reason why an instance has not been garbage collected. It does this by showing a path from the instance to a root. If root referrer identification is disabled, all roots will be presented as <root>, with no further information about the type of root.
Disable inlining
This setting determines whether method inlining should be disabled. The default behaviour is to disable inlining in order to present accurate allocation call stacks; however, this has implications on the performance of the profiled process. If the performance of the profiled process is too low, you can try to clear this setting.