Automatic Memory Analysis
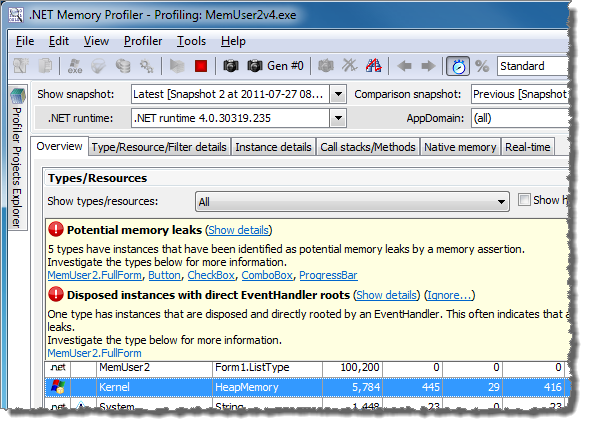
Whenever a new snapshot comparison has been performed, e.g., after collecting a snapshot or changing the selected or comparison snapshot, .NET Memory Profiler will start analysing the memory data. As soon as the analysis is finished, any found issues will be presented in info panels under the Types/Resources page, the Type details page, and the Instance details page. An example of summary issues presented in the info panel under the Types/Resources page can be seen below.
The issues presented provide warnings, suggestions, and information about common memory usage problems. The severity of an issue is defined using the following levels:
 Serious warning
A serious warning indicates an issue that could, with a high probability, cause memory usage problems, such as memory or resource leaks. Warning
A warning indicates an issue that could cause memory usage problems, such as memory or resource leaks. Minor warning
A minor warning indicates an issue that could cause bad memory or resource utilization, but it should not cause problems like memory leaks.
Minor warning
A minor warning indicates an issue that could cause bad memory or resource utilization, but it should not cause problems like memory leaks. Indirect warning
An indirect warning indicates an issue that is caused by another warning issue. The issue will contain information about the issue that causes the direct warning. Suggestion
A suggestion indicates an issue that, similar to the minor warning, could cause bad memory or resource utilization. Information
The information level indicates issues that provide information about memory usage, but they are not directly related to a memory usage problem. Indirect information
The indirect information level indicates that an issue is a consequence of another informational issue. Pending issue
The pending issue level indicates that there is a possible issue, but that further analysis has to be performed. This level is currently only used for duplicate instances that are not fully investigated. For more information, see Duplicate Instances Detection.
An issue can be related to a specific instance (e.g. a potential memory leak), a specific type (e.g. a type with undisposed instances), or the full snapshot memory data (e.g. a summary of the total ASP.NET cache usage).
Note
Only managed data is analysed for memory issues. Currently, there is no automatic analysis for native memory and resources.