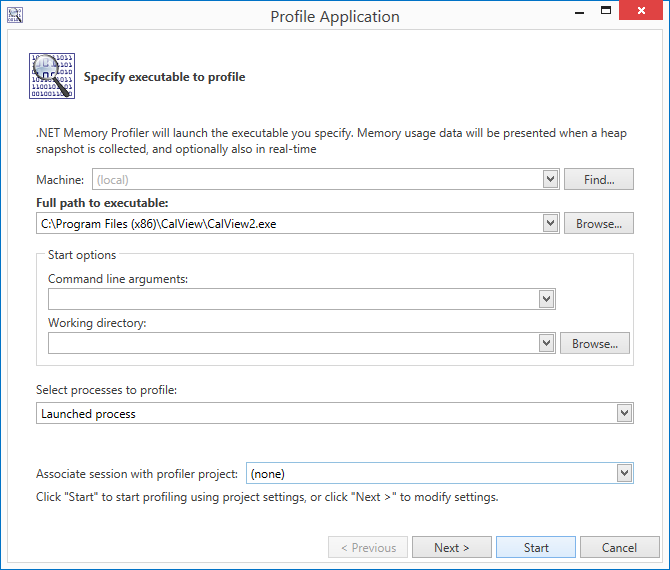
Profile Application - a wizard helps you start profiling.
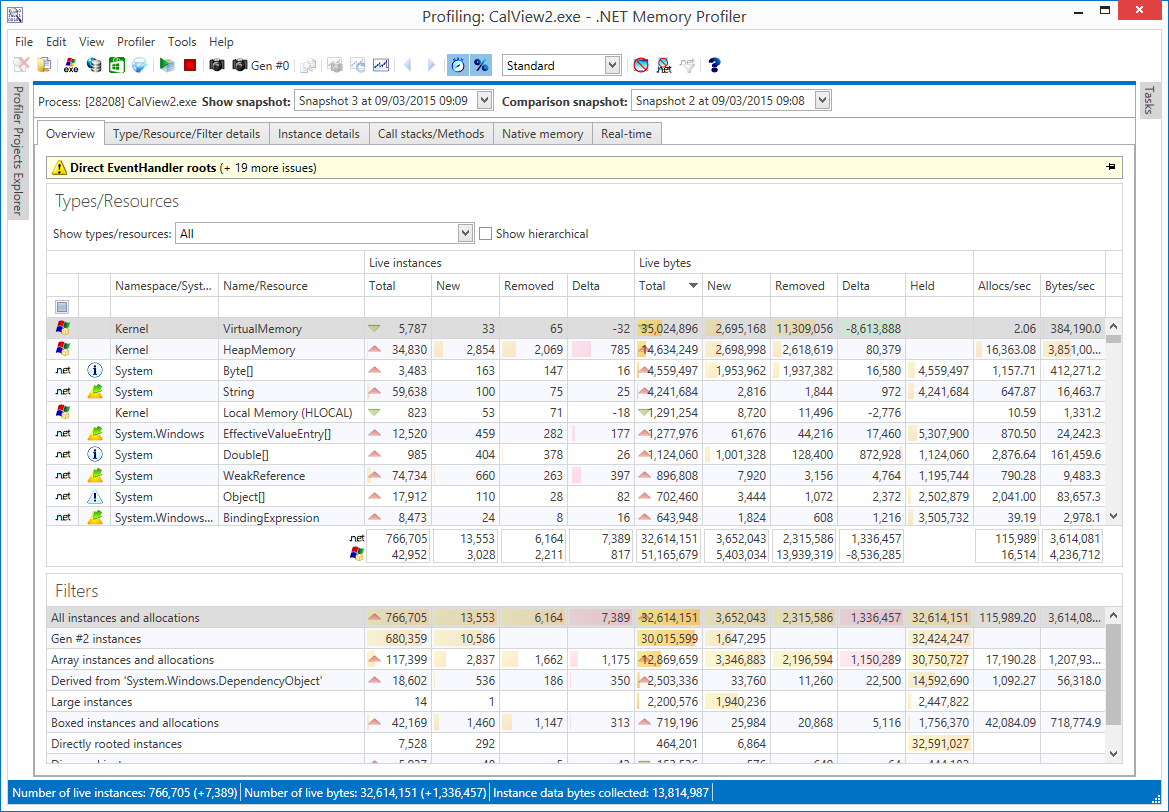
Overview - the main view of a snapshot.
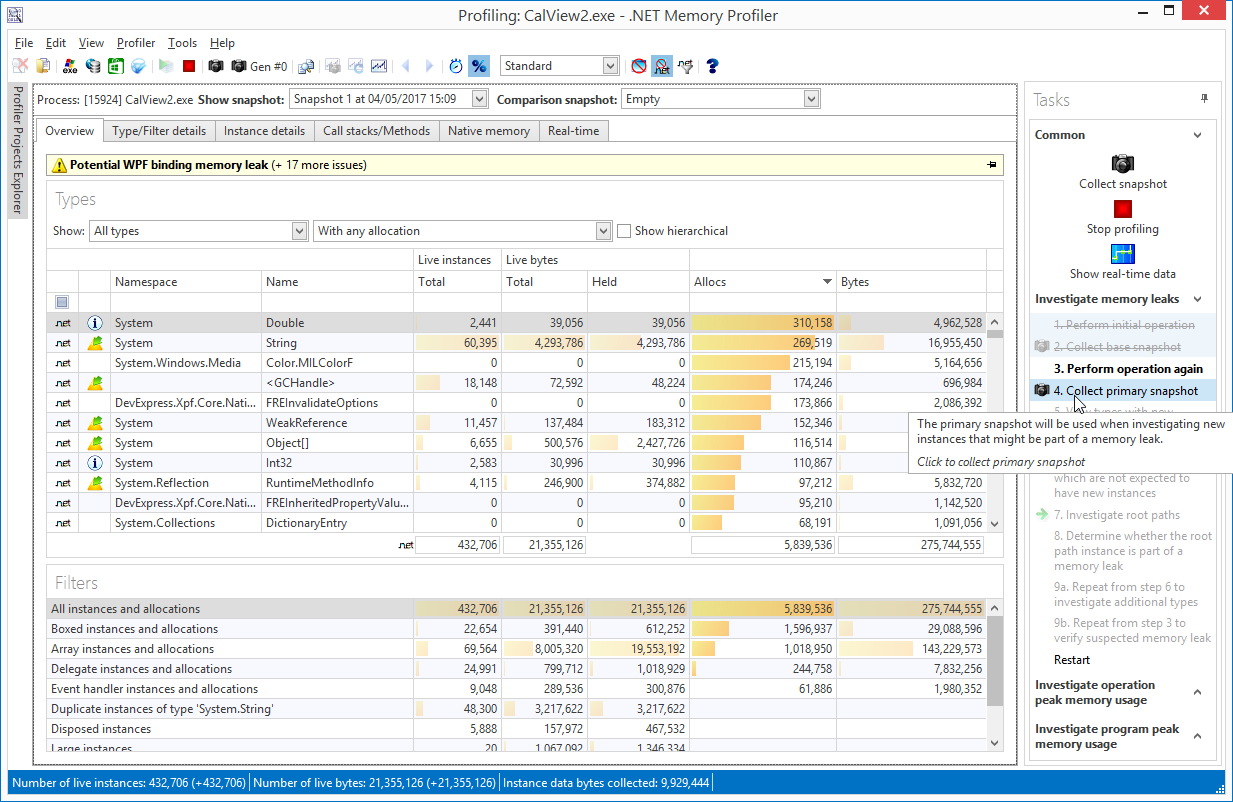
Guided profiling - profiling guides help you with common profiling tasks.
Type Details - shows the details of a single managed type.

Filter Details - shows the details of an instance and allocation filter.
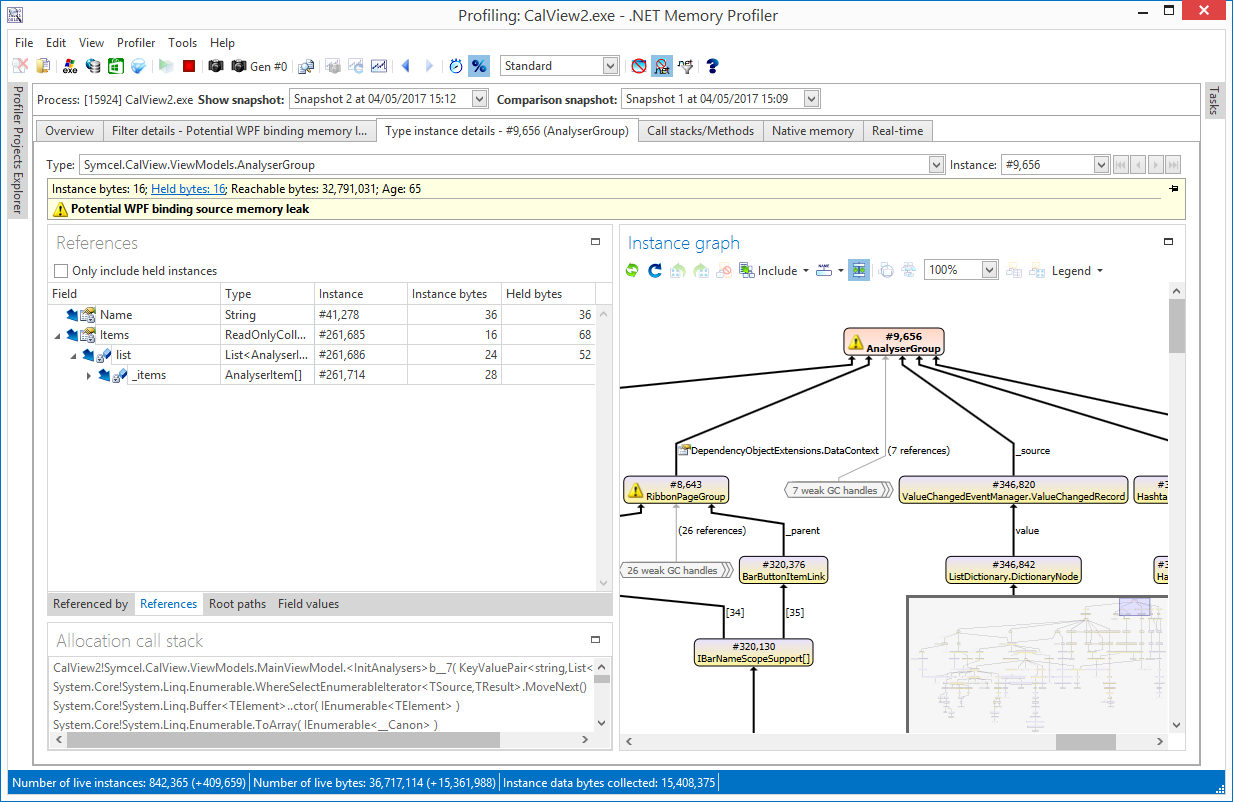
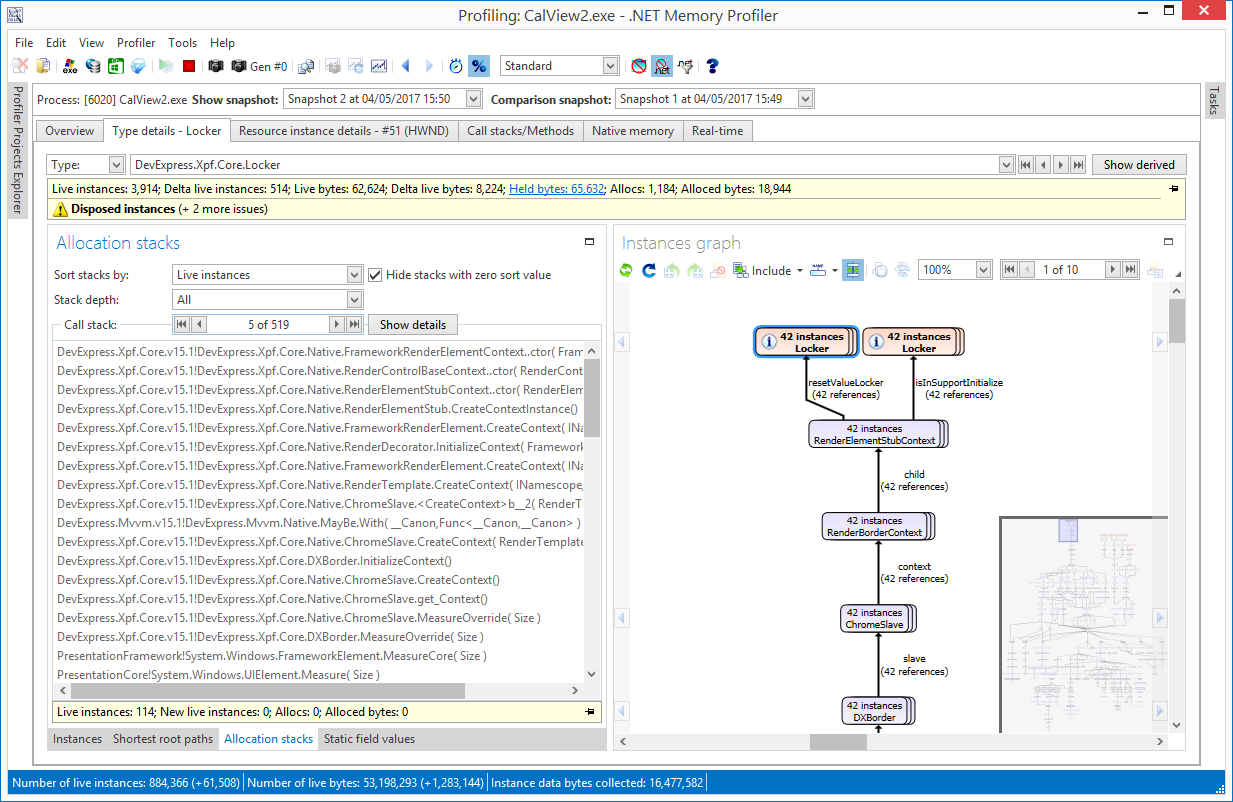
Type Instance Details - shows the details of a single type instance, including the instance graph.
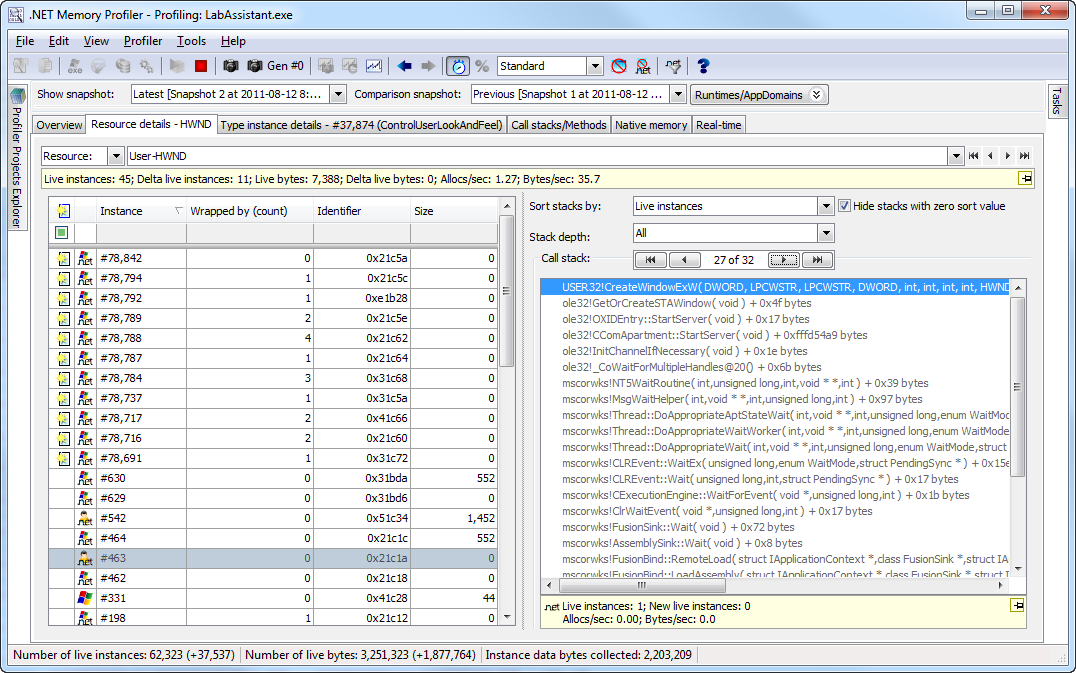
Resource Details - shows the details of an unmanaged resource.
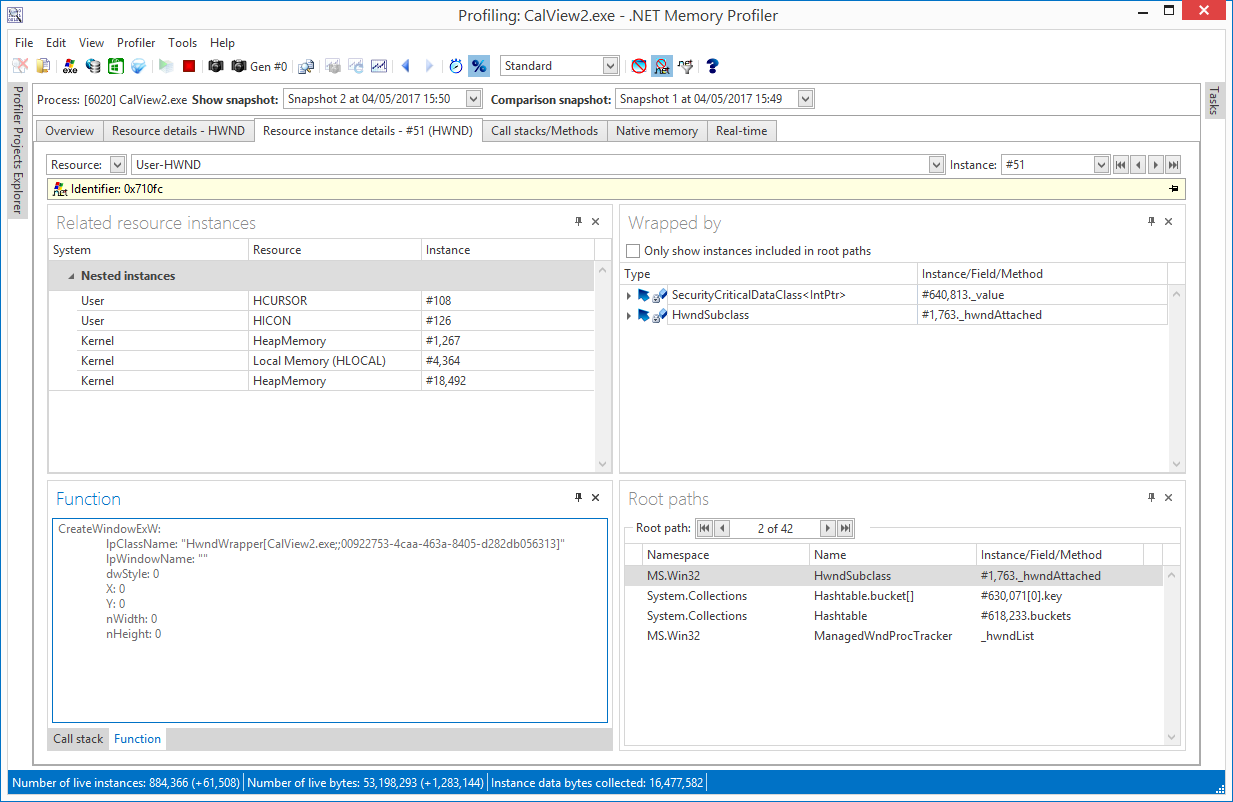
Resource Instance Details - shows the details of a single resource instance.
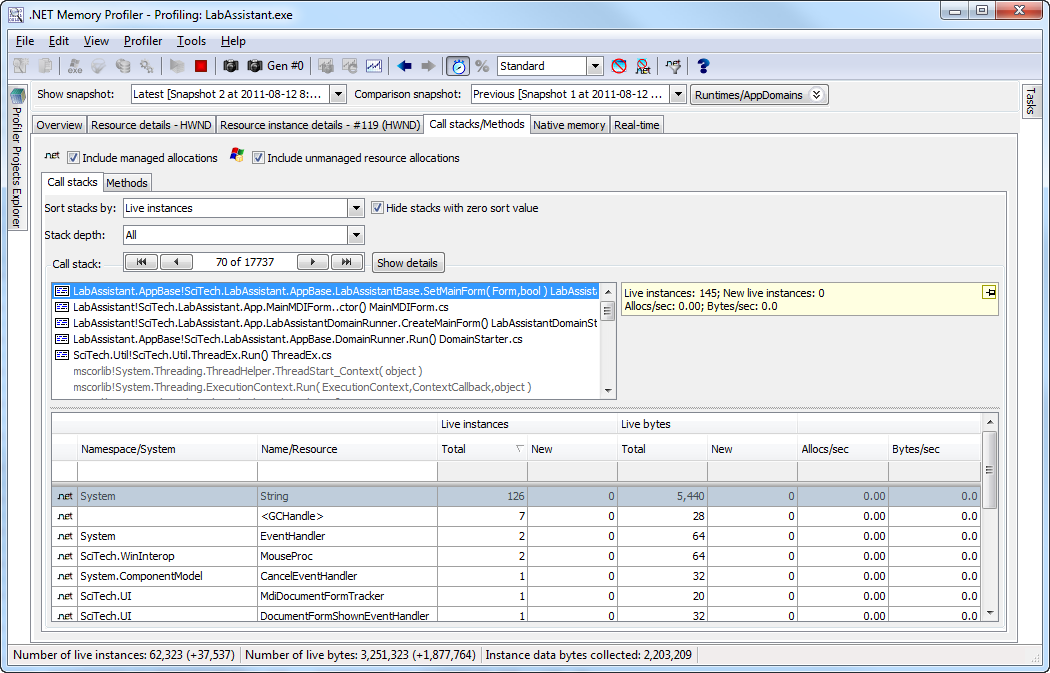
Call Stacks - shows information about all call stacks that have created any instance.

Methods - shows information about methods that have created any instance.
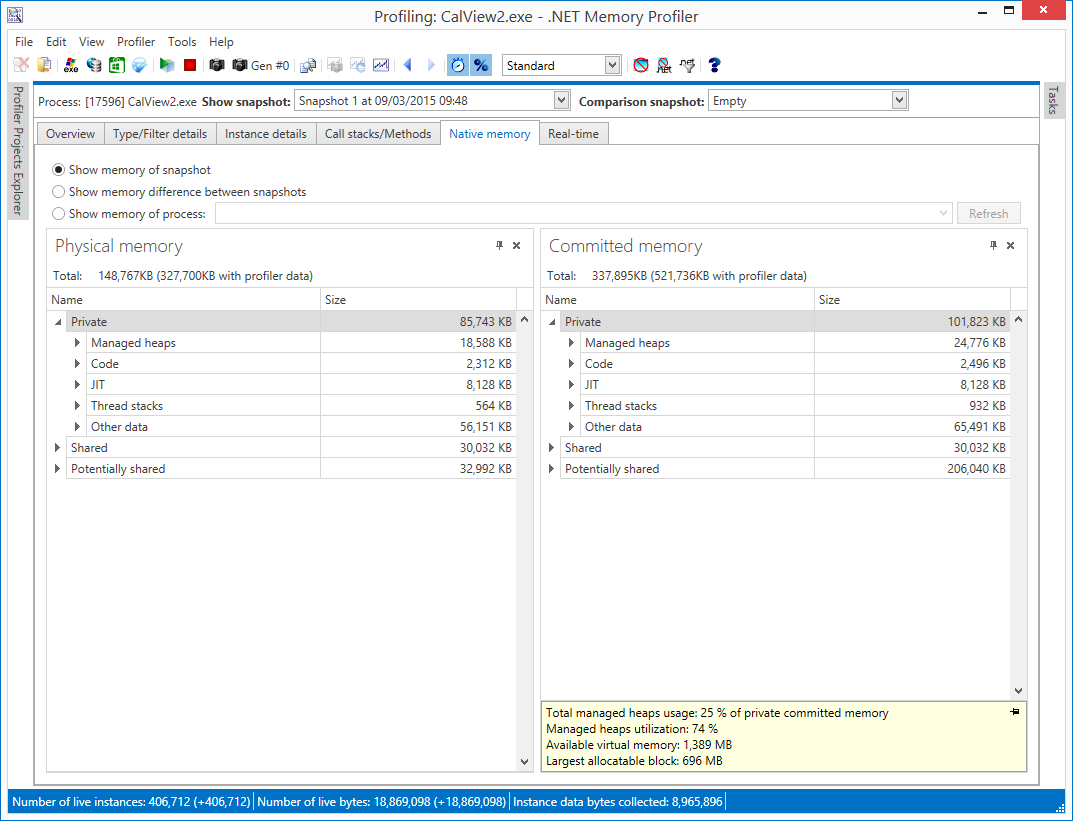
Native Memory - shows information about the native memory usage of a process.
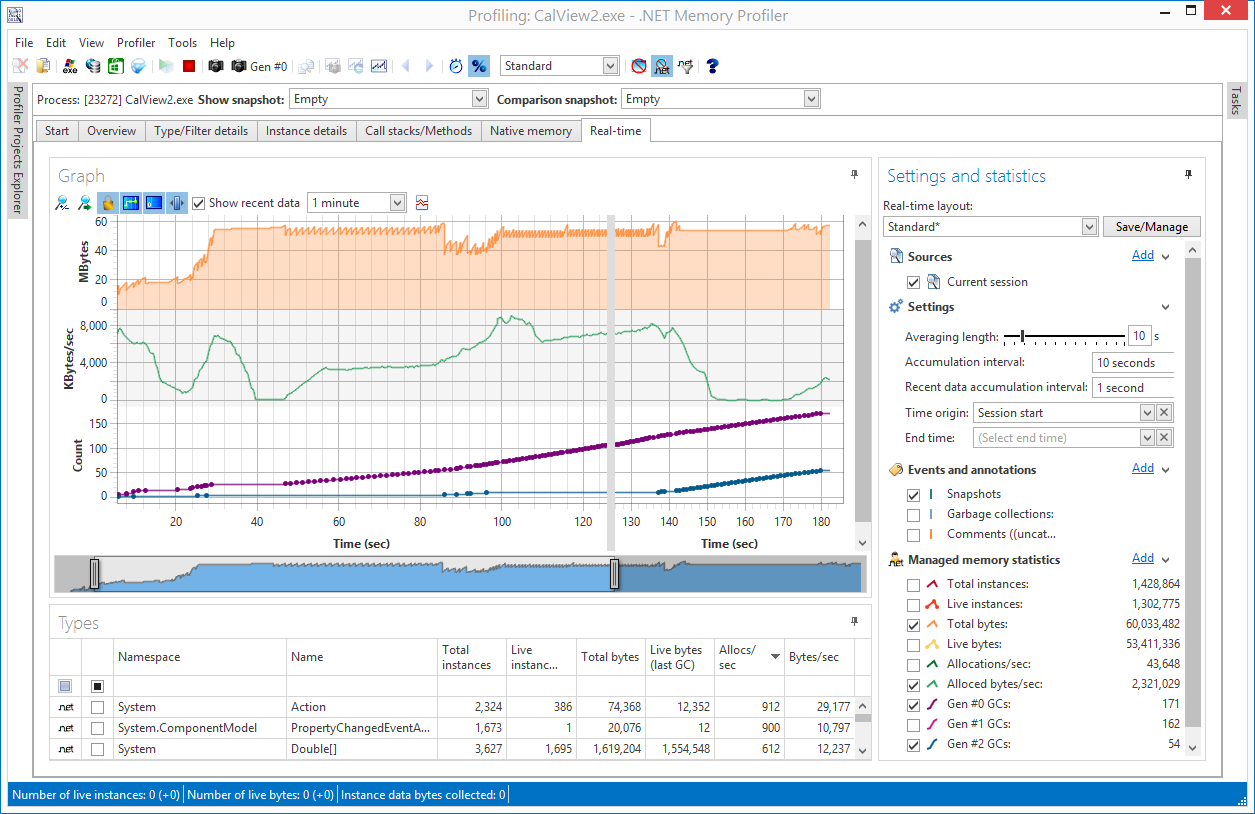
Real Time - graphical and numeric presentation of real-time memory and resource information.

Visual Studio Integration - .NET Memory Profiler can be used within Visual Studio 2015/2017/2019.
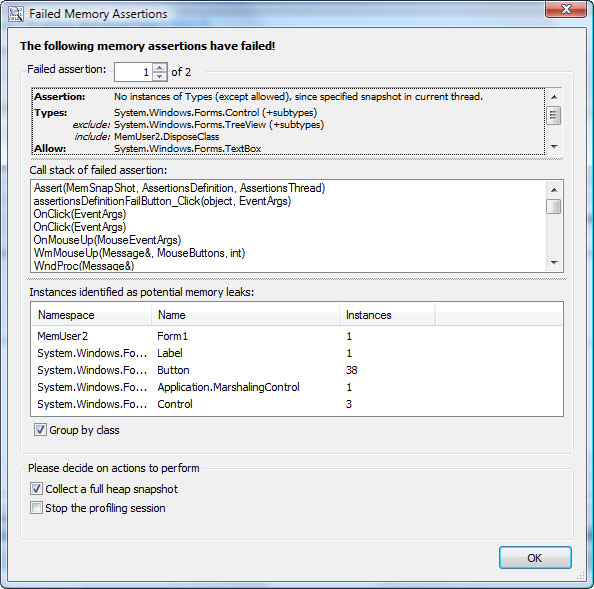
Failed Memory Assertions - shows information about memory assertions that have failed, possibly indicating memory leaks.
