 Reduce Resource Usage
Native resources, such as Win32 heap memory, window handles, and file handles, are used in a managed .NET program as well. Even though they may not be directly used by your application, they can be indirectly used by the .NET runtime, Windows, and native libraries.
By using .NET Memory Profiler you can make sure that native resources are released as quickly as possible, and that there are no resource leaks.
.NET Memory Profiler will:
The dispose tracker will give you information about disposable instances that are not correctly disposed. Disposable instances often wrap native resources. Failing to dispose an instance can delay the release of a native resource, or even cause a resource leak. (more...)
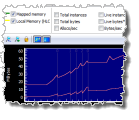
The unmanaged resources tracker will collect information about all native resources and allocations. This information is presented in the real-time view, giving you a good overview of the resource usage of your program. (more...)
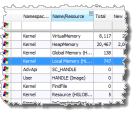
When the resource tracker is enabled, the snapshots include information about resource instances and allocations. By comparing snapshots, it will be easier for you to detect resource leaks (similar to the way managed memory leaks are detected).
.NET Memory Profiler will help you reduce resource usage. Download the free trial to see how it can help you ensure that there are no resource leaks in your application.
Download Free Trial
© Copyright 2001-2023. SciTech Software AB
All rights reserved.
SciTech Software AB
Ynglingavägen 1-3
SE-177 57 Järfälla
Sweden
E-mail: mail@scitech.se
Telephone: +46-706868081