 Investigate Memory Problems in Production Code
.NET Memory Profiler provides the most detailed information when you start the profiled application from the profiler. However, this is not always possible when troubleshooting memory problems in a production application, e.g. when the problem occurs on a customer’s computer and cannot be easily reproduced.
With .NET Memory Profiler you can:
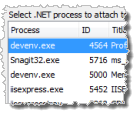
When you cannot start the profiled application from the profiler for any reason, you will still be able to attach to a running process and get detailed memory usage information.
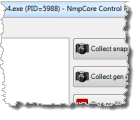
The NmpCore tool is a free standalone tool for collecting
snapshots and creating session files on machines where .NET Memory Profiler is not installed.
It requires no installation and make it easy to retrieve memory data from remote sites.
(more...)
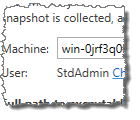
Remote profiling allows you to use a development computer to profile a process running on a computer where you do not want to or cannot install the full profiler. The NmpCore tool is used on the remote computer to provide remote profiling access to the computer. (more...)
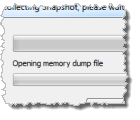
Sometimes all you have is a memory dump file. Import it using .NET Memory Profiler, and you can easily get a visual overview of the memory usage of the process.
.NET Memory Profiler will help you retrieve memory information from programs that cannot be started from the profiler. Download the free trial to see how it can help you investigate memory issues in production code applications.
Download Free Trial
© Copyright 2001-2023. SciTech Software AB
All rights reserved.
SciTech Software AB
Ynglingavägen 1-3
SE-177 57 Järfälla
Sweden
E-mail: mail@scitech.se
Telephone: +46-706868081