 Make Your Programs Run Faster
If your program uses too much memory, performs too many allocations, or has bad allocation patterns, the performance will suffer. This can affect not only your program, but other programs as well. With .NET Memory Profiler you will get the information you need to ensure that the memory usage of your program is as efficient as possible.
.NET Memory Profiler will:
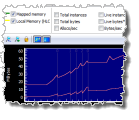
The heap-utilization tracker will tell you how the managed heaps are used and indicate bad allocation patterns. The dispose tracker will help you make sure that disposable instances are correctly disposed. Together, this information can help you optimize the memory and resource usage of the application.
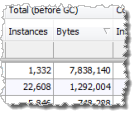
By using the new peak snapshot collection, you can get detailed information about the peak managed memory usage of your application. (more...)
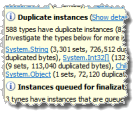
The automatic memory analyzer in .NET Memory Profiler will give you detailed information about all duplicated instances. This includes simple duplicates, like duplicated strings, and complex duplicates, such as large identical hashtables. This information will help you avoid unnecessary memory usage caused by the duplicates. (more...)
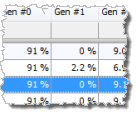
The profiler presents real-time information about all .NET instance allocations performed on the garbage collected heap and all instances that reside on the heap. (more...)
The dispose tracker will give you information about disposable instances that are not correctly disposed. Disposable instances often have finalizers and wrap native resources. Failing to dispose an instance can cause costly finalization and delay the release of a native resource. (more...)
The article "Memory Usage Optimization in Charts Library" contains useful information about how the performance of an application can be improved by optimizing the memory usage of the program.
.NET Memory Profiler will help you make your programs run faster. Download the free trial to see how it can help you optimize memory and resource usage in your application.
Download Free Trial
© Copyright 2001-2023. SciTech Software AB
All rights reserved.
SciTech Software AB
Ynglingavägen 1-3
SE-177 57 Järfälla
Sweden
E-mail: mail@scitech.se
Telephone: +46-706868081