The major new features of .NET Memory Profiler 5.5 are:
- Redesigned real-time presentation
- Compare real-time data between sessions
- Collect performance counter data
- Significantly improved call stacks collection and presentation
- Improved "inspection-only" attach to process and memory dump import
- New profiler API functionality to retrieve memory usage from within the profiled process
- NuGet packages for the profiler API and NmpCore
- Snapshot filters
- Additional analysis issues
- Improved clean-up of lingering instances when collecting a snapshot in a WPF process
- Support for Universal Windows Apps and .NET Core
- Support for Visual Studio 2017
Redesigned real-time presentation
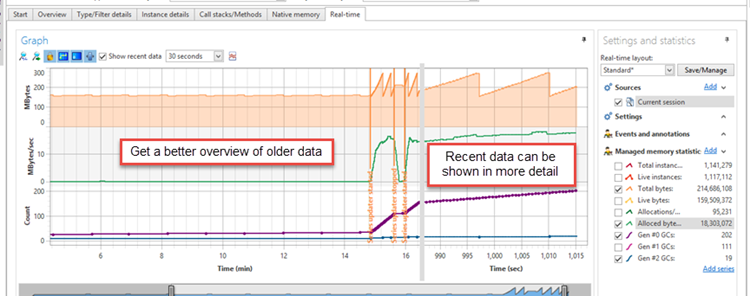
The real-time data presentation has been redesigned. You can now:
- Change how the real-time data is presented
- Show recent data in better detail while still getting a good overview of older data
- Add and remove series
- Include data from additional sessions
- Work with multiple real-time layouts
Recent data can be shown in more detail by selecting the "Show recent data" option.
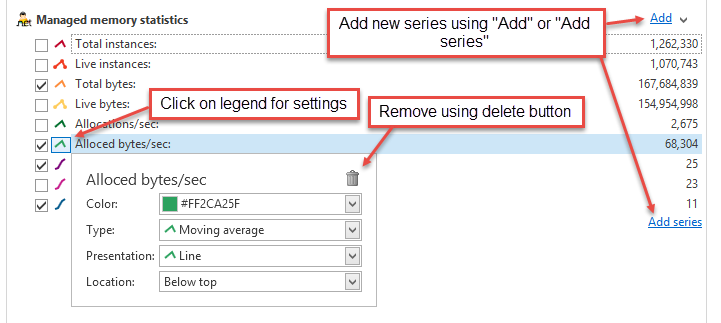
Series settings are changed by clicking the legend icon. The legend icon can also be used to remove series from the real-time view. To add a series in an existing category, use the "Add" link, to add series from a new category, use the "Add series" link.
Compare real-time data between sessions
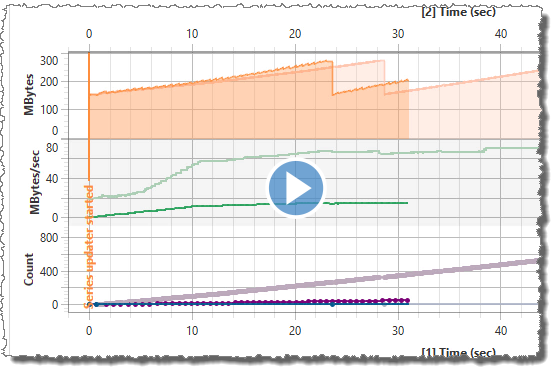
It is now possible to add multiple profiler sessions to the real-time graph. This makes it possible to compare the memory behavior against a previously stored session, e.g. to see how well an optimization worked.
The screencast below shows how to add a previously stored session to the real-time data.
Collect performance counter data
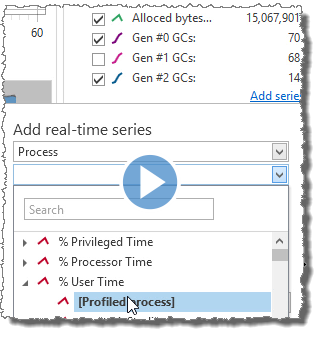
Data from the Windows performance counters can also be included in the real-time data. A performance counter can be added using the "Add series" link. For more information see the screencast below:
Significantly improved call stacks collection and presentation
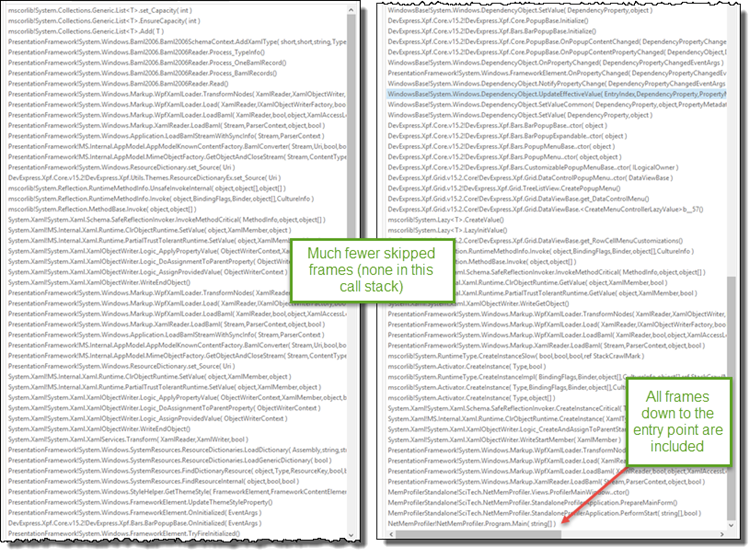
The collection of allocation call stacks in the profiler has been re-implemented. The profiler is now able to collect much more detailed call stacks information, without truncating the call stacks. The screenshots below show the difference between a call stack in version 5.0 and a call stack in version 5.5.
Call stack from .NET Memory Profiler 5.0:
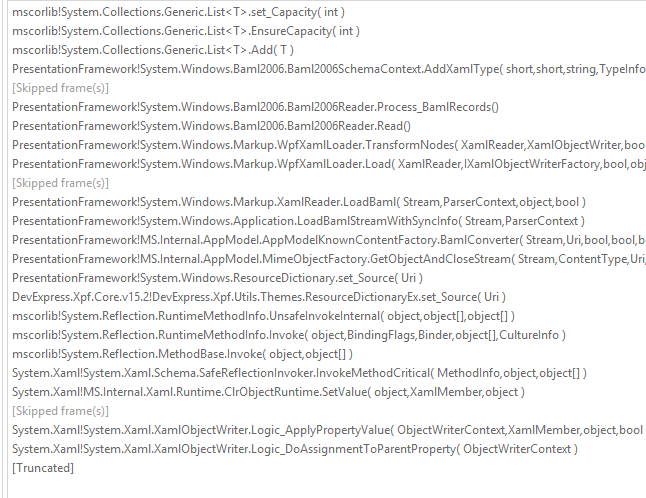
Same call stack from .NET Memory Profiler 5.5:
Of course it is still possible to use the user interface to reduce the call stack depth and select which methods to include.
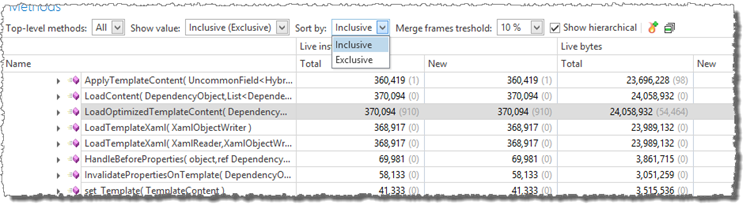
By default, the methods tree now presents two values at the same time, both information about allocations performed by the method itself (exclusive) and allocations performed by the methods and all called methods (inclusive). How the values are presented and sorted can be selected using the "Show value" and "Sort by" fields.
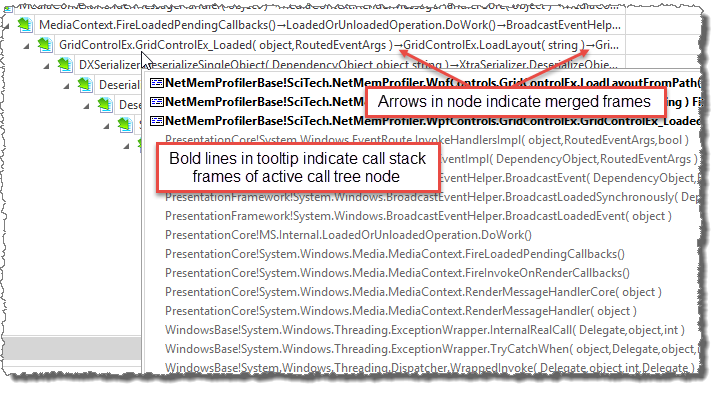
To prevent that the call tree becomes very deep, the profiler will merge call stack frames with little or no unique information into a single node.
Improved "inspection-only" attach to process and memory dump import
Inspection only attach (previously known as "Debugging tools attach") and memory dump import have been significantly improved. It no longer has a dependency on "Debugging Tools for Windows" or the "SOS" library. Attaching to a process and importing memory dumps is now faster and more reliable.
New profiler API functionality
The possibility to retrieve the memory usage information from within the profiled process has been added. The method MemProfiler.GetMemoryUsage can be used to investigate how memory has been used since a base snapshot. This includes information about live instances and allocations performed.
The code below shows how the memory usage can be retrieved:
public void TestMemoryUsage()
{
    // Collect a snapshot to use as the base when retrieving memory usage.
    var baseSnapshot = MemProfiler.FastSnapshot(true);

    //
    MethodThatShouldBeTested();

    // Retrieve information about the memory usage (live instances and allocations)
    // since the base snapshot
    var memUsage = MemProfiler.GetMemoryUsage(baseSnapshot);

    var instances = memUsage.GetLiveInstances();
    var allocs = memUsage.GetAllocationsInfo();

    Console.WriteLine("Number of new live instances: {0} (using {1} bytes)",
        instances.NewInstancesCount,
        instances.NewBytesCount );
    Console.WriteLine("Number of performed allocations: {0} ({1} bytes)",
        allocs.AllocatedInstancesCount,
        allocs.AllocatedBytesCount
    );

    // It is also possible to retrieve instances for a specific type
    var bitmapInstances = memUsage
        .GetLiveInstances( typeof( System.Drawing.Bitmap) );
    Console.WriteLine("Number of new bitmap instances: {}",
        bitmapInstances.NewInstancesCount );

    // ... or for a set of types
    var typeSetInstances = memUsage.GetLiveInstances(TypeSet.Empty
        .AddNamespace( "System.Windows" )
        .Add( typeof( System.Drawing.Image ), true) );
    Console.WriteLine(
        "Number of new instances in System.Windows namespace and derived from Image: {0}",
        bitmapInstances.NewInstancesCount);
}
The GetMemoryUsage method makes it possible to assert the memory usage in a more direct way compared to using an AssertionsDefinition (see example below). However,
instances will not be marked as potential memory leaks when asserting memory usage using the MemoryUsage class.
MemoryUsage memUsage = MemProfiler.GetMemoryUsage(baseSnapshot);
TypeSet types = ...;
var instances = memUsage.GetLiveInstances( types );
var allocs = memUsage.GetAllocationsInfo( types );

Assert.LessOrEqual(1, instances.NewInstancesCount);
Assert.LessOrEqual(10, allocs.AllocatedInstancesCount);
Two more assertions have also been added to the AssertionsDefinition class: MaxAllocations and MaxAllocatedBytes (with the corresponding
attributes MaxAllocationsAttribute, MaxAllocatedBytesAttribute).
For more information about the new API functionality, see the API reference in the installed documentation.
NOTE! The name of the profiler API library has changed to "SciTech.MemProfilerAPI.dll" and is now available as a NuGet package (see below). There are some breaking changes
in the new API assembly, including a few name changes, e.g. FastSnapShot->FastSnapshot and MemSnapShot->MemSnapshot,
but most importantly, the FastSnapshot method no longer stores the snapshot as a default base snapshot.
It is recommended that the base snapshot is always specified in API methods like MemProfiler.GetMemoryUsage and MemAssertion.Assert, but it is also
possible to supply true as the storeAsBaseSnapshot parameter to MemProfiler.FastSnapshot.
NuGet packages for the profiler API and NmpCore
The .NET Memory Profiler API and NmpCore are now available as NuGet packages.
The following packages are available
- SciTech.MemProfilerApi: The .NET Memory Profiler API library, including the API classes like MemProfiler and MemAssertion.
- SciTech.NmpCore.Task: Includes the free NmpCore tool and the NmpCore MsBuild task.
-
SciTech.NmpCore.TestProject: Includes a .NET Memory Profiler test project that will automatically run unit tests under NmpCore after build. To activate the NmpCore
select "NmpCore" as the build action for the file ProfileTest.prfproj.
The profiler project can be edited using the XML-editor in Visual Studio, or by opening the project in .NET Memory Profiler.
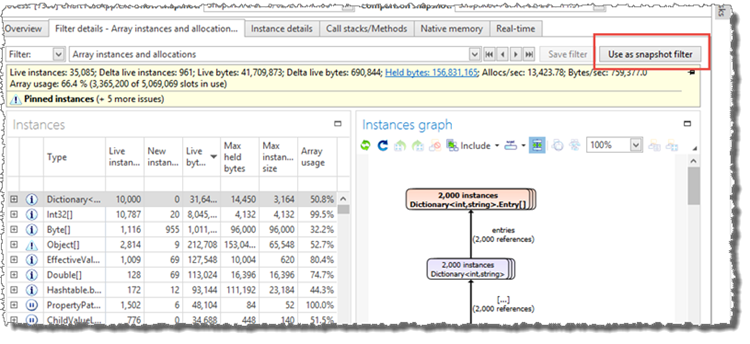
Snapshot filters
It is now possible to click "Use as snapshot filter" in the filter view. This will use the currently selected filter as a filter for the snapshots comparison. This makes it easier to get detailed information about a specific set of instances and instance allocations.
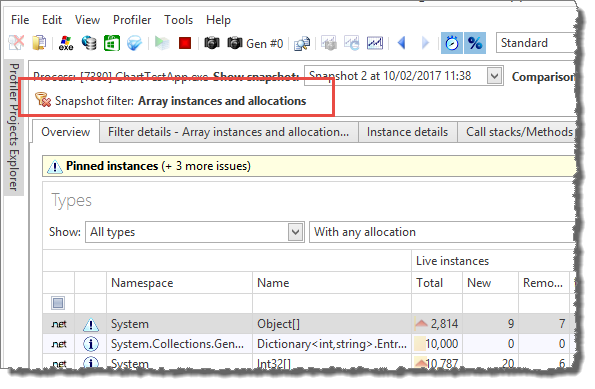
After clicking "Use as snapshot filter", an indication of the used filter will be shown at the top of the profiler window, and the snapshot views will
only include information about instances and allocations included by the filter (note this only applies to managed instances, native resource instances are not affected by the filter).
Support for Universal Windows Apps and .NET Core
Universal Windows apps are now included in the list of apps when "Profile Windows app" is selected.
.NET Core profiling is supported by using "Profile application" and then specifying the "dotnet.exe" program, the working directory of the .NET Core application and the path to the application library as program argument (if necessary). It is also possible to use the "Profile ASP.NET" command to profile a .NET Core web application hosted by IIS Express or IIS.
In-depth .NET Memory Profiling
Download .NET Memory Profiler to see how it can help you find memory leaks and optimize memory usage in your application.
Download Free Trial