The major new features of .NET Memory Profiler 5.7 are:
- Improved support for .NET Core 3.x, .NET 5.0, .NET 6.0, and .NET 7.0
- New implementation of debug profiling
- New implementation of unit test profiling
- Unit test data collector for VSTest
- Better support for Visual Studio 2019/2022 and the latest Visual Studio previews
- Hybrid inspection snapshots
- Identification of delegate target Method
- WPF cleanup support in .NET Core 3.x, .NET 5.0, .NET 6.0, and .NET 7.0
- Identification of instances in the pinned heap
Improved support for .NET Core 3.x, .NET 5.0, .NET 6.0, and .NET 7.0
This includes a new debug symbols reader with support for portable PDBs, delegate target method identification, and WPF profiling support.
New implementation of debug profiling
The new implementation makes use of the debugger API available in Visual Studio 2017 and later, and no longer relies on undocumented behavior that could potentially cause problems (support for Visual Studio 2012-2015 has been dropped in version 5.7).
-
Supports both 32- and 64-bit processes
Previous implementation ran within the Visual Studio process and was limited to debug only 32-bit processes. - Handles more debug targets
-
Allows both debugger attach and profiler attach
Previous implementation required that the the process was started with both debugging and profiling enabled. Now the debugger can be attached to a profiled process, or the profiler can be attached to a debugged process.
New implementation of unit test profiling
The new implementation is based on the new unit test data collector (NmpDataCollector) and supports the latest releases of Visual Studio 2019/2022 and Visual Studio Previews, as well as Visual Studio 2017.
With the new debug profiling implementation, it is now also possible to debug unit tests that run under the profiler.
NOTE! Even though the unit test profiling is based on NmpDataCollector, it is not required to install the NmpDataCollector package to run unit tests under the profiler within Visual Studio.
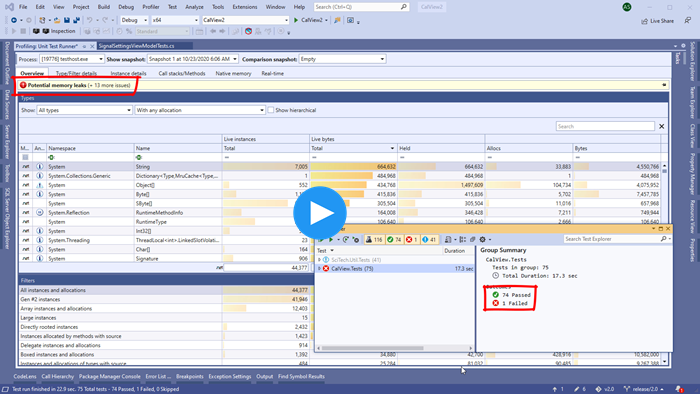
The screencast below shows how unit tests can be run under .NET Memory Profiler.
Unit test data collector for VSTest
NmpDataCollector is a VSTest data collector that can be added to a unit test project. It is available as a NuGet package and makes it very easy to run unit tests under the profiler within the build process, e.g. a CI/CD pipeline.
For more information, see the NMP Data Collector page.
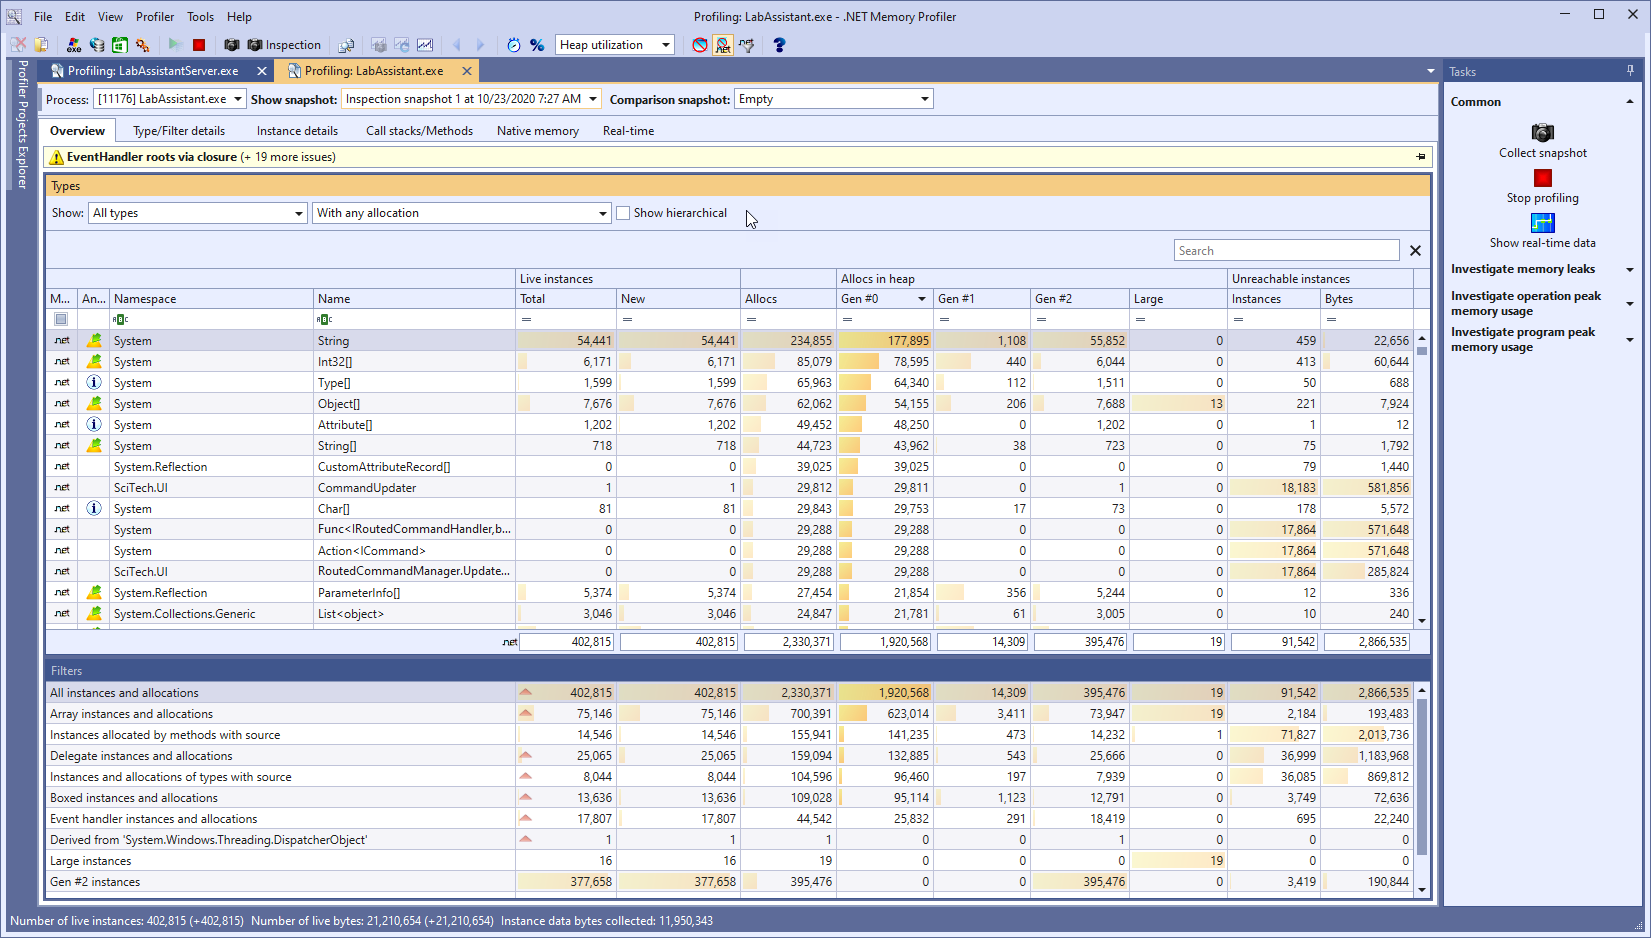
Hybrid inspection snapshots
Normally the profiler will try to allow the runtime to garbage collect as many instances as possible before collecting a snapshot. This significantly reduces the risk of falsely identifying instances as memory leaks. However, when investigating and optimizing memory utilization, e.g. using the heap utilization tracker, it is better to get information about the actual memory usage at the time of the snapshot.
The new inspection snapshot will collect the memory usage information as it is, including unreachable instances and no prior garbage collection. This is the same type of snapshot that is collected when doing inspection profiling, but with all the additional information that is available for a standard snapshot, e.g. allocation call stacks.
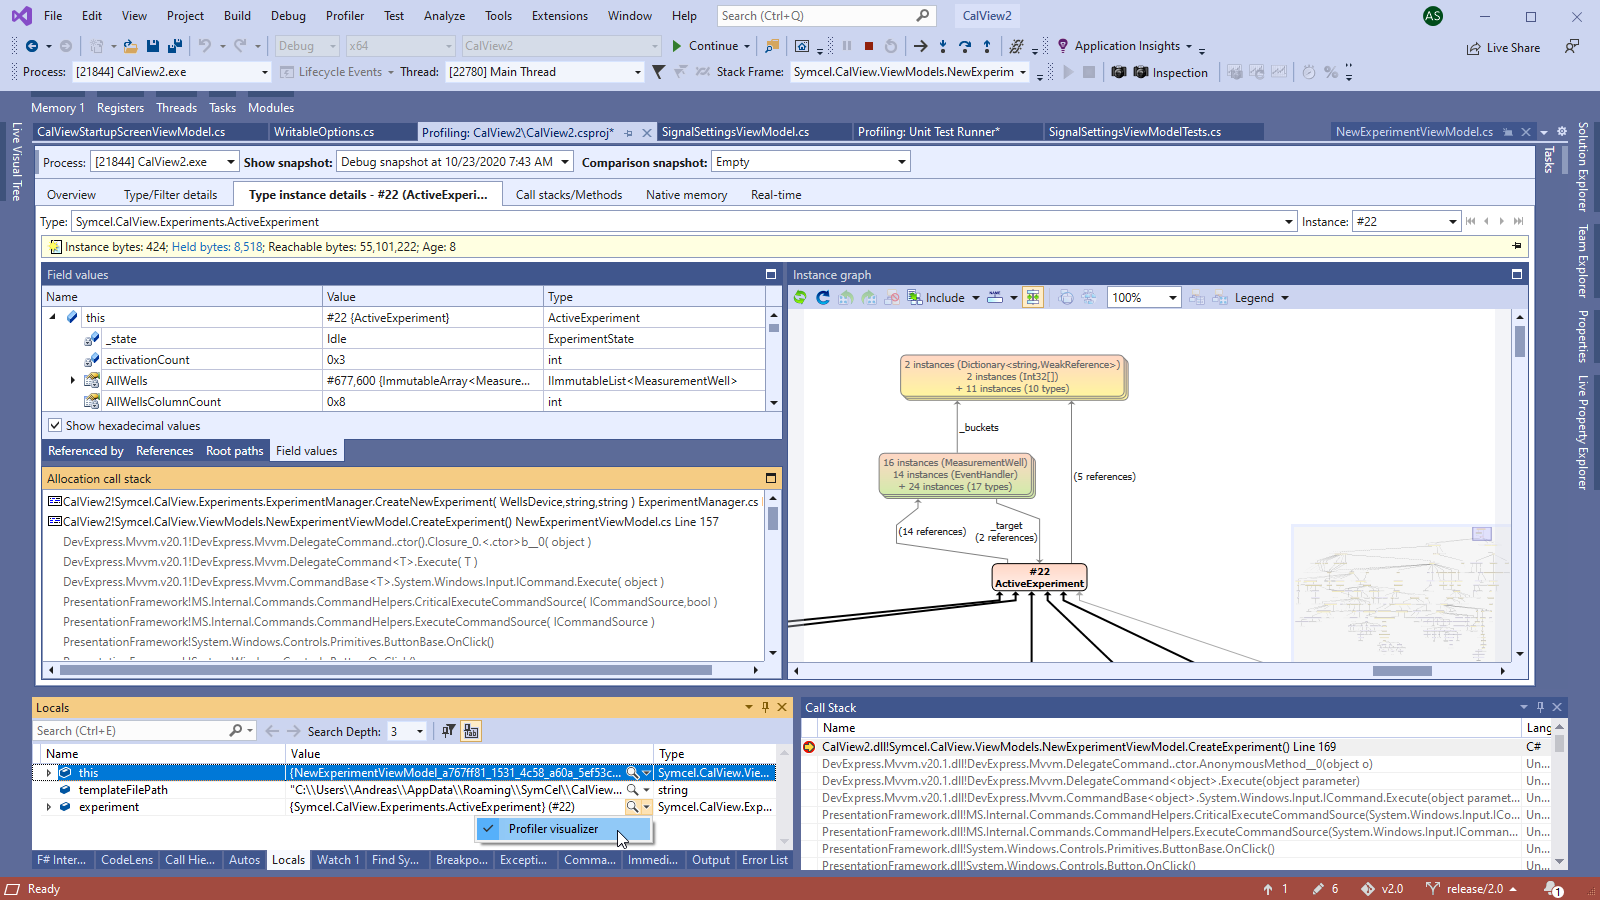
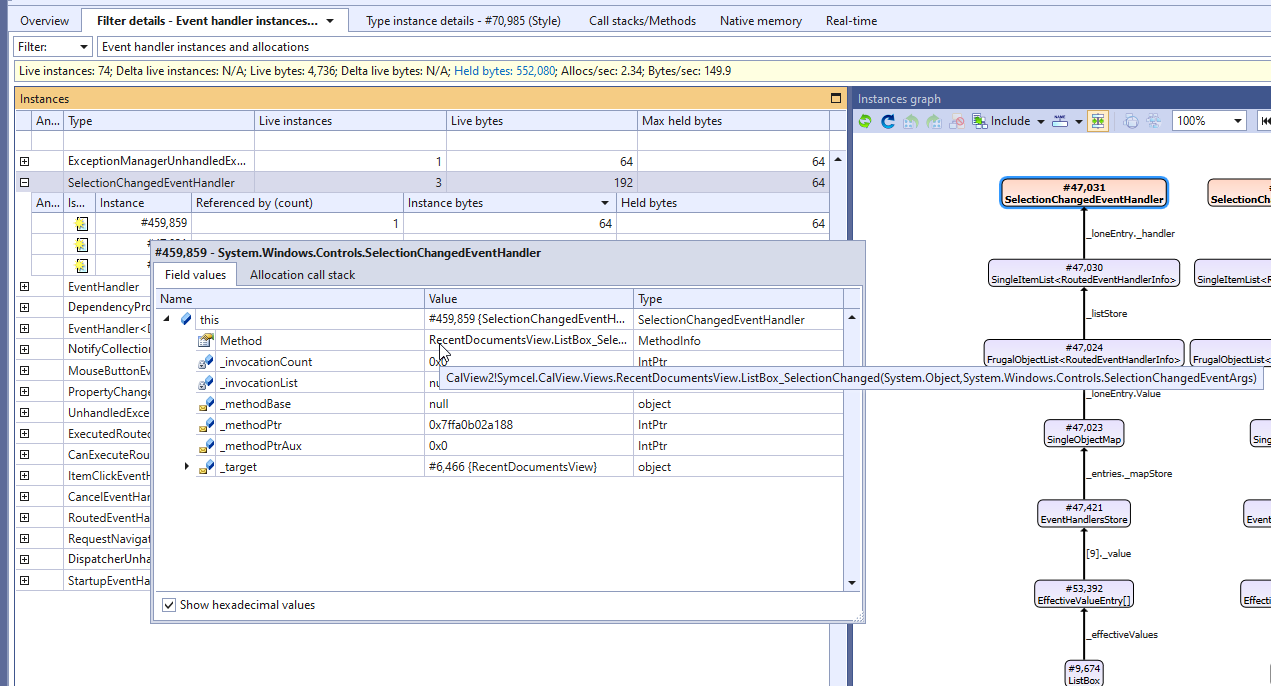
Identification of delegate target Method
When profiling a process running under .NET Core 3.0 or later, the profile will identify the target Method of a delegate. This will make it
easier to identify the reason why a delegate was created or why it has not been removed. This is especially important when allocation call stack information is not available, e.g. when
attaching or investigating a memory dump file.
WPF cleanup support in .NET Core 3.x, .NET 5.0, .NET 6.0, and .NET 7.0
As part of the memory cleanup the profiler tries to perform before collecting a snapshot, it triggers the cleanup of stale data bindings in WPF. This was implemented in .NET Memory Profiler 5.5, but caused problem when profiling a WPF application running under .NET Core 3.0 or later. Now WPF cleanup is fully supported under .NET Core 3.x, .NET 5.0, .NET 6.0, and .NET 7.0.
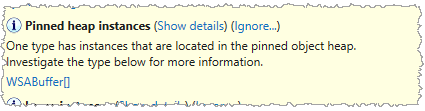
Identification of instances in the pinned heap
.NET 5 has introduced a new managed heap, the pinned heap, where it will place instances that are allocated as pinned (using GC.AllocateArray or GC.AllocateUninitializedArray). .NET Memory Profiler will identify instances that are placed in this heap, and present this information using an analysis issue and in the native memory view.
What's New in .NET Memory Profiler 5.6?
To see what was new and updated in .NET Memory Profiler 5.6, see the what's new information for version 5.6.
In-depth .NET Memory Profiling
Download .NET Memory Profiler to see how it can help you find memory leaks and optimize memory usage in your application.
Download Free Trial