The major new features of .NET Memory Profiler 5.6 are:
- Presentation of field values in the type instances list
- Improved filtering and presentation of type instances
- Run tests using the DevExpress CodeRush testrunner
- Decompile methods in call stacks (using DevExpress CodeRush)
- Select roots to include/exclude in the instance graphs
- Better navigation of types, resources, filtes, and instances
- Visual Studio integration as external process
- Themes
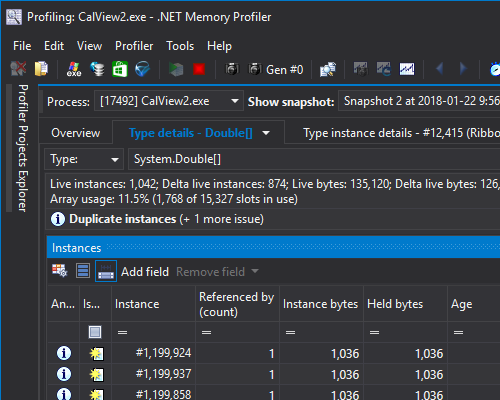
Presentation of field values in the type instances list
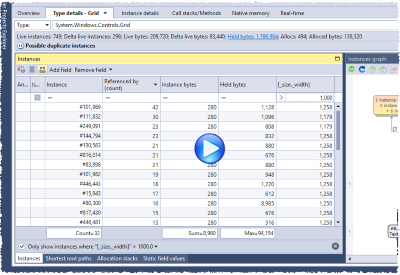
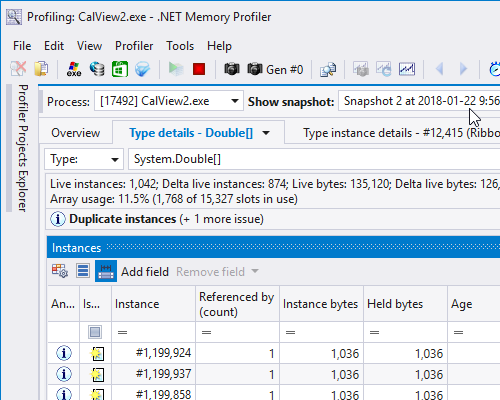
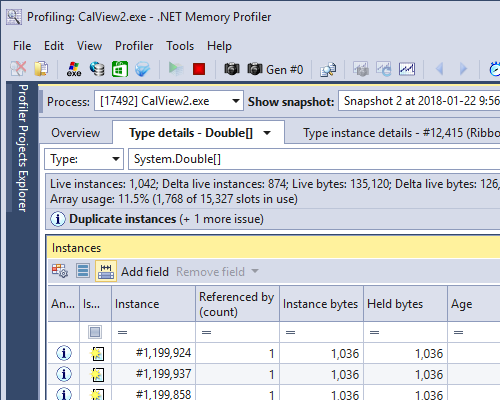
Field values can now be presented in the type instances list (under Type details). With the help of the improved filtering (see next section) this makes it easier to find or investigate specific instances in a snapshot. A field is added using the "Add field" command in the type instances list, or by using the context menu in the instance fields pop‑up.
The screencast below demonstrates how instance fields can be added.
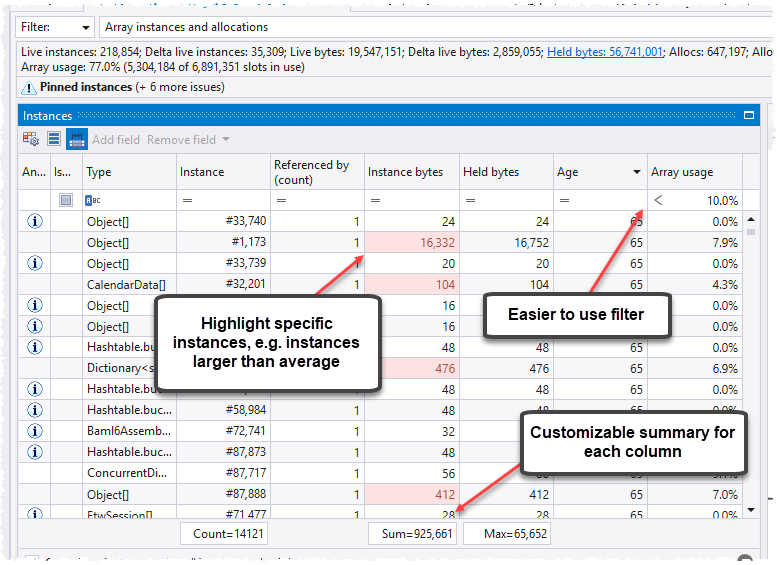
Improved filtering and presentation of type instances
The table presentation of types/resources and instances has been improved, especially for the type instances list. Summary information is presented for columns, filtering is improved, and it is possible to highlight specific instances using conditional formatting.
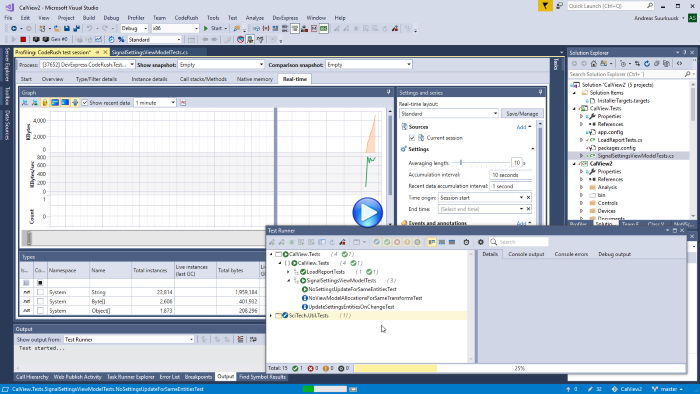
Run tests using the DevExpress CodeRush testrunner
(available in CodeRush 17.2.6)
If DevExpress CodeRush is installed in Visual Studio, it is possible to run unit tests under the memory profiler using the CodeRush test runner. This is more convenient and intuitive than using the "Run tests under memory profiler" command. The CodeRush test runner is supported in the Professional and Enterprise editions of .NET Memory Profiler.
The screencast below shows how the CodeRush test runner can be used to run unit tests.
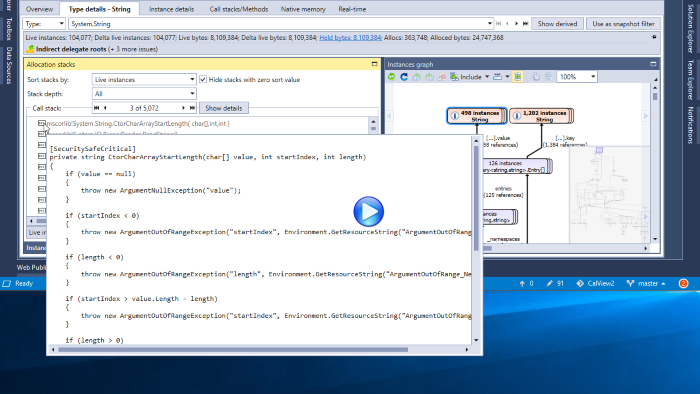
Decompile methods in call stacks (using DevExpress CodeRush)
(available in CodeRush 17.2.6)
If DevExpress CodeRush is installed in Visual Studio, the decompiler feature in CodeRush will be used to decompile methods in presented call stacks.
The screencast below shows how decompiled source (and actual source, if available) is presented for the call stack methods.
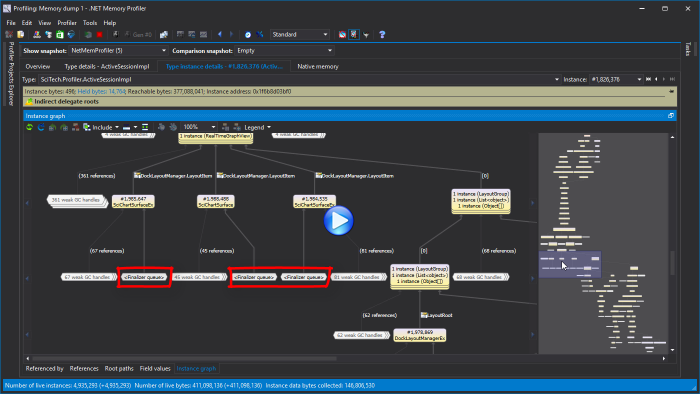
Select roots to include/exclude in the instance graphs
It is now possible to select which roots to include in the instance graph. This is especially useful when investigating an "inspection-only" snapshot, i.e. when the profiler has not induced a garbage collection or performed other heap clean-up actions before the snapshot.
The screencast below shows how roots can be excluded to simplify the instance graph of a suspected memory leak instance (this is based on an actual memory leak detected in a memory dump of .NET Memory Profiler).
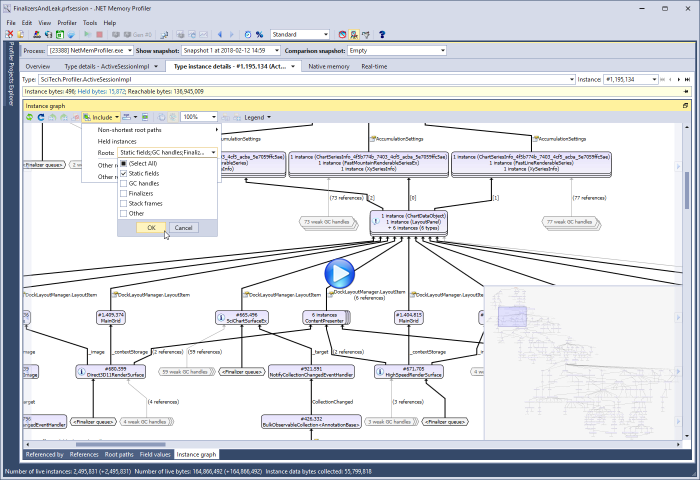
If excluding roots causes all roots to be removed, then the instance graph will consist of only the selected instance.
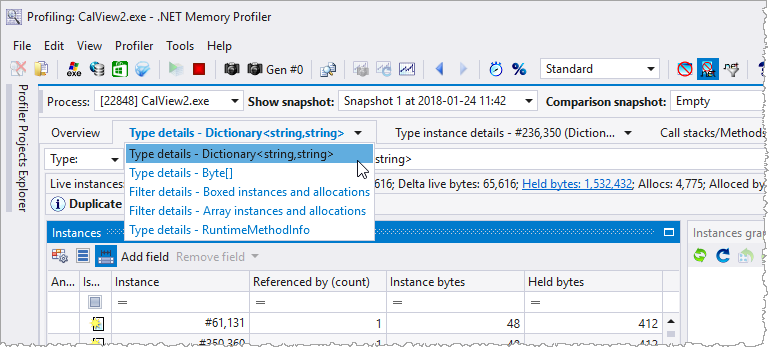
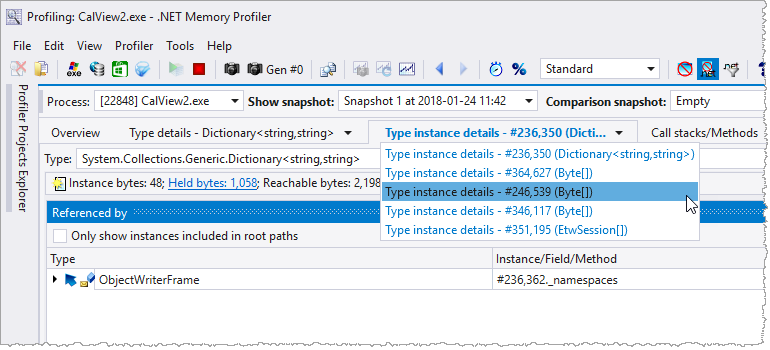
Better navigation of types, resources, filters, and instances
Better navigation of type/filter/resource details and instance details has been added to the header of the details pages. A drop-down list is available in the page headers, making it easier to navigate back to previously investigated details.
Details navigation is available for the Type/Resource/Filter details page:
Details navigation is also available for the instance details page:
Visual Studio integration as external process
.NET Memory Profiler now runs as a separate process even when profiling from Visual Studio. This allows the profiler to work with much larger sessions and profile processes with much higher memory usage. It also provides better isolation between Visual Studio and the profiler, better performance, and reduced conflicts with third-party components.
The profiler consumes a lot of memory when profiling processes with high memory usage and it is therefore recommended to run the profiler as a 64-bit process. However, when integrating the profiler with Visual Studio, the profiler would previously run within the Visual Studio process. Visual Studio is a 32-bit process, which itself consumes a lot of memory, so running the profiler within the Visual Studio process significantly limits the size of the processes that can be profiled and could also cause out-of-memory errors in Visual Studio.
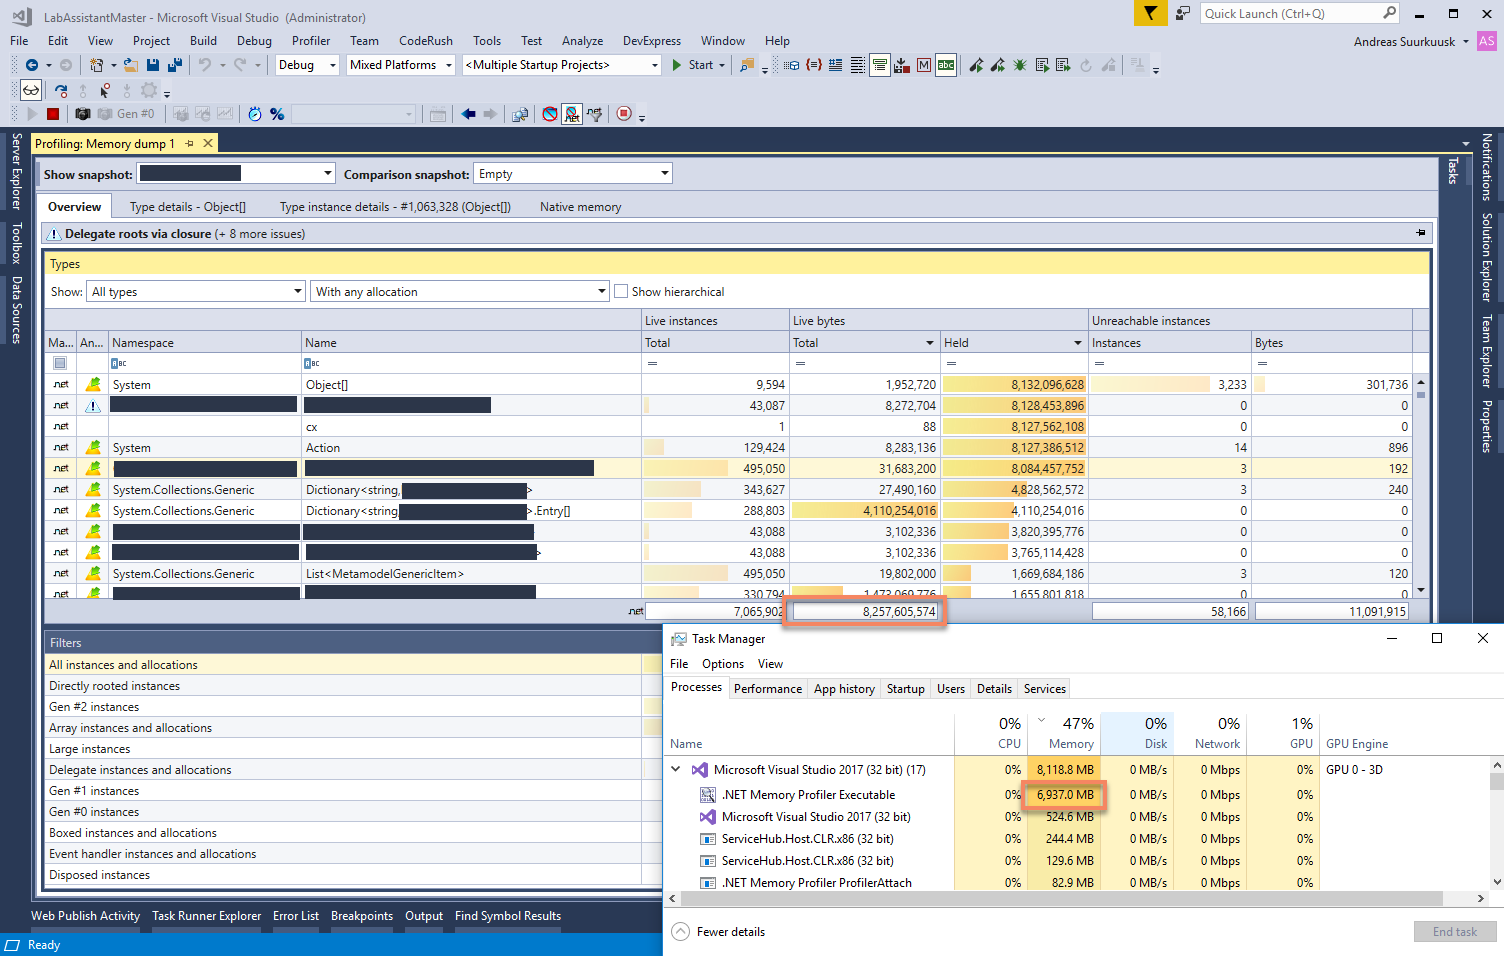
The screenshot above shows the import of a memory dump import of a file larger than 8 GB. After the import, .NET Memory Profiler consumes close to 7GB of memory, which would not be possible within the Visual Studio process.
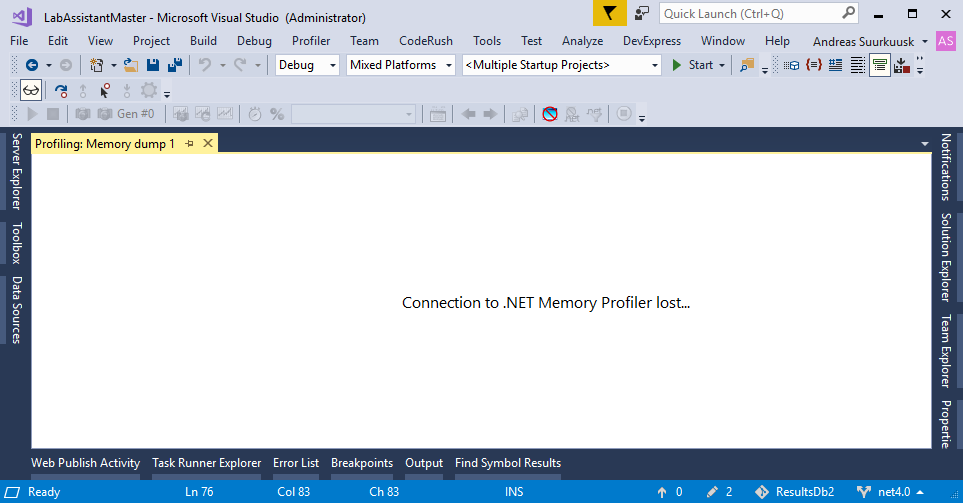
In the hopefully unlikely event that .NET Memory Profiler crashes, the new Visual Studio integration will prevent that this crash also brings down Visual Studio.
Themes
.NET Memory Profiler now includes three user interface themes, matching the Visual Studio themes (Light, Blue, Dark).
Light theme:
Blue theme:
Dark theme:
What's New in .NET Memory Profiler 5.5?
To see what was new and updated in .NET Memory Profiler 5.5, see the what's new information for version 5.5.
In-depth .NET Memory Profiling
Download .NET Memory Profiler to see how it can help you find memory leaks and optimize memory usage in your application.
Download Free Trial