Methods View
The methods view is used to present information about methods that have performed instance allocations.
The methods information is presented in a tree. This tree includes three levels of information:
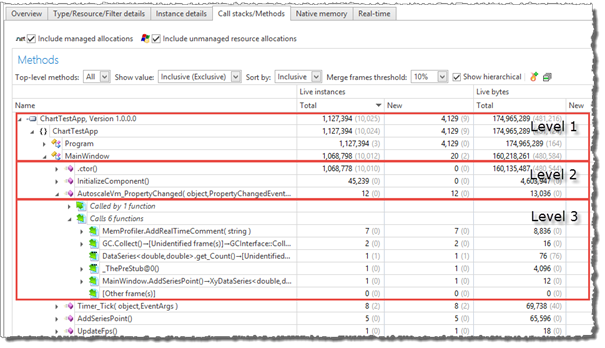
Container information
The assembly/module, type, and namespace that contains the base method. This level presents summary information from child items in the tree. For example, the Live instances summary information for a type includes the sum of all live instances created by all methods in the type. This level is only included if the Show hierarchical checkbox is checked.Base method
This level presents the base methods and provides allocation information for the method itself. The actual allocations included in the information depends on the Include setting described below.Callers of the method and functions called by the method
This level can be used to get information about functions that called the base method, and functions that are called by it. By expanding the Called by and Calls child nodes, partial call stacks that start or end with the base method can be built.
Allocation information will be presented for all allocations that match this partial call stack.
By default, the methods tree now presents two values at the same time, both information about allocations performed by the method itself (exclusive) and allocations performed by the methods and all called methods (inclusive). How the values are presented and sorted can be selected using the Show value and Sort by fields.
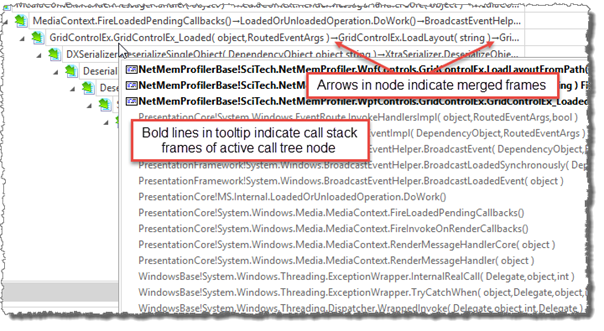
To prevent that the call tree becomes very deep, the profiler will merge call stack frames with little or no unique information into a single node (an arrow indicator, ‘→', is used to indicate multiple frames in a node). All frames of the partial call stack are presented in a tooltip.
Above the methods tree, there is a toolbar with the following settings and actions:
Top-level methods
The Top level methods dropdown list defines which functions should be included as base functions in the methods tree. The available options are:
Source
Only include functions and methods that have source information.Source and externally visible
Only include native functions that are exported or managed methods that are externally visible, or methods that have source information.All
Include all functions and methods that are available in all call stacks.
Show value
This drop-down list is used to select the values to present for each column in the call tree. The available options are:
Inclusive (Exclusive)
Show both the inclusive value (allocations performed by the method and all called child methods) and the exclusive value (allocations performed by the method itself). The exclusive value is presented within parenthesis.Inclusive
Only show the inclusive value.Exclusive
Only show the exclusive value.
Sort by
If more than one value is presented per column, this drop-down list can be used to select the value to use when sorting using the column.
Merge frames threshold
To reduce the complexity of the call tree, frames with little information can be merged into a single node, [Other frame(s)]. The threshold value is used to specify when a frame is included in the [Other frame(s)] node.
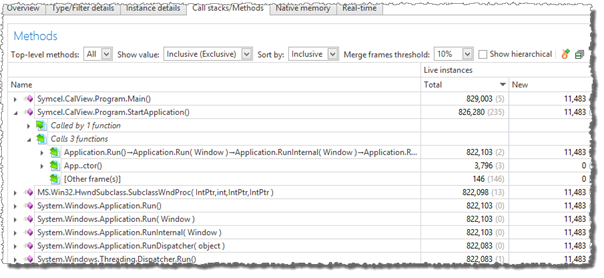
Show hierarchical
If the Show hierarchical check box is checked (the default), the functions and methods view will be presented hierarchically, based on assembly/module, type and namespace. Otherwise, the level 1 items will not be included, and the base methods will be presented in a flat list (see below).
 Expand hot path
Expands the nodes with the highest sort value from the selected node.
 Collapse all
Collapses all expanded nodes in the call tree.