Memory Leak Settings Page
The Memory Leak page contains settings that define how memory leaks detected using the.NET Memory Profiler API should be handled.
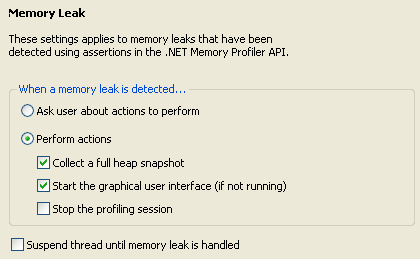
When a memory leak is detected
This setting is used to define what to perform when a memory leak is detected by a memory assertion. If Ask user about action to perform is selected, a dialog will appear when a memory leak is detected. To avoid user interaction, the Perform actions option can be used.
The following actions are available:
Collect a full heap snapshot
If this action is selected, a full heap snapshot will be collected and saved. This allows the user to analyze the instances that have been identified as potential memory leaks. Note that the number of snapshots collected is limited by the Maximum number of triggered heap snapshots setting under the Snapshots page.Start the graphical user interface
If this action is selected and the profiler is currently running in non-interactive mode, the user interface will be started.Stop the profiling session
If this action is selected, the profiling session will be ended, and the profiled process will be terminated.
If more than one action is selected, they will all be performed, starting with the top one.
Suspend thread until memory leak is handled
This setting decides whether the thread detecting the memory leak should be suspended until the selected actions have been performed. If this setting is not enabled, the thread that detected the memory leak will keep running until an additional memory leak is detected or until a heap snapshot is triggered by a call to MemProfiler.FullSnapShot.