Limiting Call Stack Depth
Note
In the current version of the profiler, the call stack depth is not (and cannot be) limited, but if opening session files created by an older version of the profiler, the call stack may be truncated.
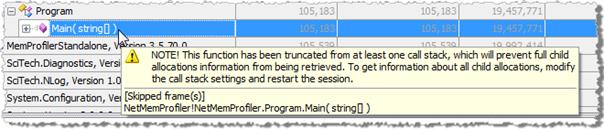
Limiting the call stack depth is an efficient way of limiting the memory usage of the call stacks information. However, truncating call stacks will obviously also cause some information to be lost. This is particularly evident when investigating allocations performed by a method and all its child allocations. If the method has been truncated from any call stack, the child allocation information is no longer accurate. This is indicated in the methods view by coloring the allocation data gray, and providing information about the truncation in the tool tip (as can be seen in the screenshot below).