Issue Presentation
As mentioned previously, issues are presented in the info panels of the Types/Resources page, the Type details page, and the Instance details page. Unless the info panel is expanded, only the first, most important, issue is presented, and only the title is included.
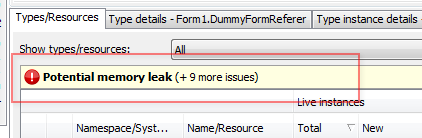
Full information about all issues is presented by expanding the info panel. This can be done by hovering the mouse over the info panel, or by using the "pin" button to the right.
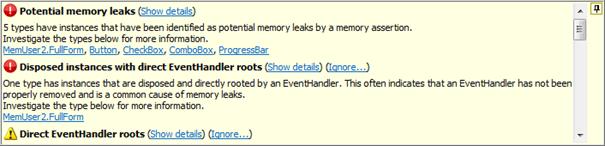
The full information includes a descriptive text for each issue and a set of links for each issue, allowing navigation to more specific issues or additional information. The (Show details) link will show the details of the issue as an instance and allocation filter. All instances and allocations that are associated with the issue will be included in the filter.
Most issues will also have an (Ignore...) link. This link can be used to ignore the issue, so that it will no longer be presented. For more information about ignoring analysis issues, see Ignoring Analysis Issues.
Overview page
In the Overview info panel, a summary for each issue is presented.
For instance-specific issues, the summary will contain links to the types that have instances related to the issue. For type-specific issues, links to the types related to the issue will be listed. Further information can be retrieved by clicking the provided links.
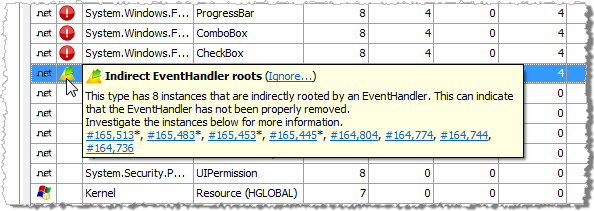
A tooltip will also be provided for each type with associated analysis issues. The tooltip is shown by hovering over the analysis icon for the type, and the information presented is the same as in the Type/Filter details info panel (described below).
Type/Filter details info panel
In the Type details and Filter details info panels, information about type and instance issues will be presented, together with other type information.
For instance-specific issues, the description will contain links to the actual instances that are related to the issue. For type-specific issues, links to further details or information might be provided. The further details can, for instance, be the allocation stacks for undisposed instances. The actual links available depend on the issue.
A tooltip will also be provided for each instance with associated analysis issues. The tooltip is shown in the Instances list, by hovering over the analysis icon for the instance. The information presented is the same as in the Instance details info panel (described below).
Instance details page
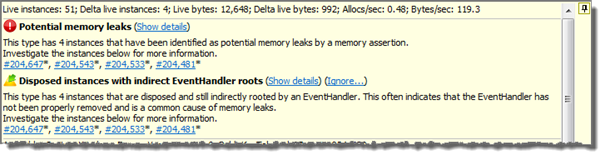
In the Instance details info panel, information instance specific issues will be presented, together with other instance information
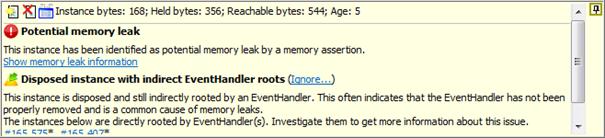
Links to further details or information might be provided. The further details can, for instance, be links to instances with "real" warning issues from an instance with an indirect warning. The actual links available depend on the issue.