Debug Profiling
(Professional and Enterprise only)
It is also possible to start a profiling session that runs under the Visual Studio debugger. To start a debug profiling session, select the  Debug with Memory Profiler command under Profiler menu. This will start the profiling session similar to the way it is started using the Start Memory Profiler command.
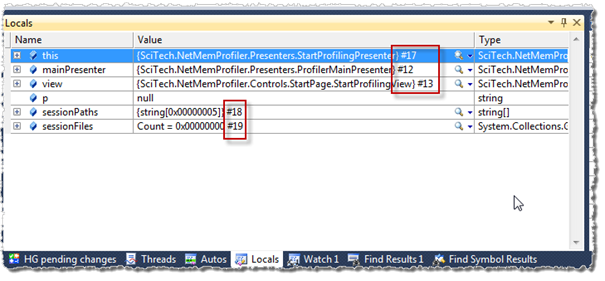
When debug profiling is enabled, the instance number for each instance is presented in all watch windows (Watch, Locals , Auto, and debugger tool tips), making it easier to identify instances while debugging.
A visualizer is also provided for each instance presented in the watch windows. It is accessed using the magnifying glass at the side of the instance value.
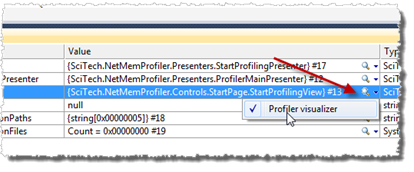
Selecting the Profiler visualizer will show the instance details of the selected instance, including information like the allocation call stack, root paths, and a full instance graph.
It is also possible to collect heap snapshots while stopped at a breakpoint. This makes it possible to investigate the memory usage of a specific operation within the debugger. For example, it is possible to stop at a breakpoint before making a method call, collect a heap snapshot, step over the method call and collect a new snapshot. The memory usage of the method can then be investigated by comparing the two collected snapshots.