Heap Snapshot Views

After a heap snapshot is collected the information about the memory is presented in the following views:

Overview

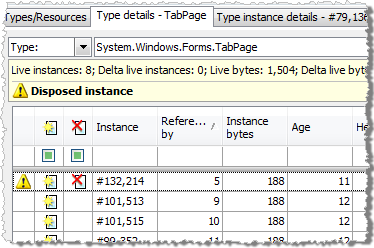
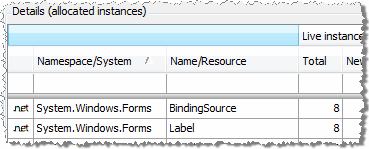
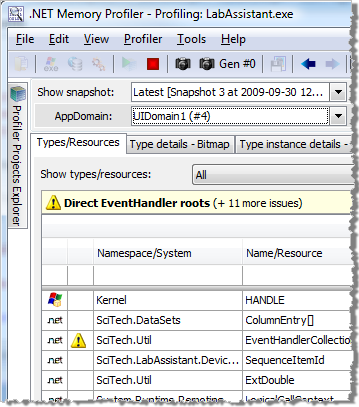
Includes a list of all the types and resources in the profiled process. This list is collected during a heap snapshot and presents the number of instances and allocated bytes of each type, as well as the number of allocations performed per second.

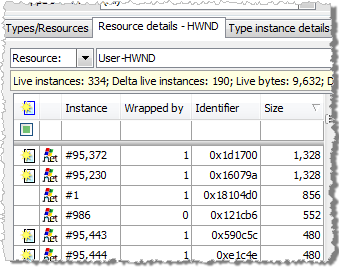
If unmanaged resource tracking is enabled, then information about unmanaged resources is also presented in this view.

Types and resources

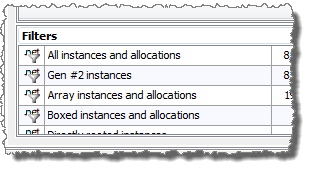
Below the Types/resources list there is a Filters list. It includes information based on saved "instance and allocation" filters. The information presented is the same as, or a subset of, the types information.

Filters

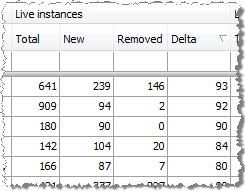
The change of live instances between two snapshots is also shown. This information can be used to find memory leaks.

New and removed instances

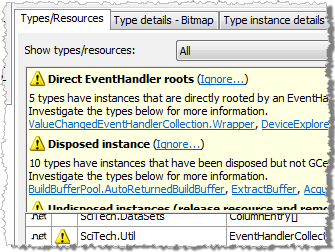
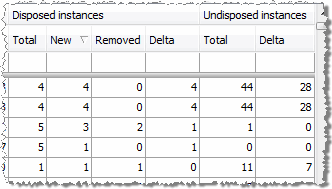
By selecting to show dispose information, information about disposed and undisposed instances is presented. Undisposed instance are disposable instances that have been garbage collected without being properly disposed.

Disposed and undisposed instances

A summary of all memory usage issues that have been identified by the automatic memory analyser is also presented in this view.

Analysis issues summary

Type/Resource/Filter Details

The details of a type, resource, or filter can be viewed by double-clicking on the entry in the Types/Resources or the Filters list.

The details shown include information about all included instances...

Type details

Resource details

...as well as the call stack of all related allocations. Each stack contains information about the number of allocations, number of allocated bytes and the number of live instances. The stack information can be used together with the Allocs/sec and Bytes/sec columns in the Types/Resources view to discover excessive allocations, and to pinpoint where the allocations occur.

Allocation call stack

A combined instances graph will show you the root paths of all selected instances, the instances of the selected shortest root path, or the instances of the selected allocation call stack.

The shortest root paths of all managed instances are also presented.

Shortest root paths browser

The navigation buttons can be used to easily browse through a selected set of types or resources.

Navigation buttons

Instance Details

The details of a specific instance can be viewed by double-clicking on an instance entry.

The details of a managed type instance include base information such as size, age and the state of the instance (New, Disposed etc.). Additionally, information about all references to and from the selected instance, the allocation stack of the instance and, most important, all paths to all roots of the instance are also included.

The instance details also includes an instance graph, providing a visual overview of the selected instance, and all its related instances and roots.

Instance graph

If instance data has been collected, the values of the fields will also be displayed.

The instance fields can be presented in a style mimicking the watch windows in Visual Studio, or they can be presented in a flat style; in the order they are defined.

Instance field values

All root paths are listed starting with the shortest path.

The root paths are extremely useful to find out why an instance is not garbage collected.

When a reference to an instance is presented, both the instance number and the name of the referring field is included. This makes is easier to find out how an instance is referenced and why it has not been garbage collected.

Root path field names

The details of an unmanaged resource instances include base information such as the identifier, size and the state of the instance. Additionally, information about managed type instances that wrap the resource instance is displayed, as well as the allocation stack of the instance.

Resource instance details

If several resource instances are created during the same function call, they will be presented as related resource instances.

Related resource instances

In addition to the call stack of the instance creation, the function arguments provided to the creation function are also presented.

Resource creation arguments

The navigation buttons can be used to easily browse through a selected set of instances.

Navigation buttons

Call Stacks/Methods

Information about all allocation call stacks and methods can be viewed using the Call stacks/methods page. It presents information about all saved call stacks (or methods). The allocation stacks can be useful to find code that perform excessive allocations. It can also be used to locate call stacks (or methods) that are responsible for creating a large number of live, disposed or undisposed instances.

Call stacks Methods view

Details about the allocations performed by a call stack or method are also presented.

Call stack details

Native Memory

The Native Memory Page presents information about the native memory of a process. Native memory is the memory managed by the operating system, rather than the Common Language Runtime.

.NET Memory Profiler also makes use of the information collected by the unmanaged resources tracker (if enabled) when presenting native memory, allowing more detailed information to be identified.

Native memory view

© Copyright 2001-2023. SciTech Software AB
All rights reserved.

CONTACT INFO

SciTech Software AB
Ynglingavägen 1-3
SE-177 57 Järfälla
Sweden

E-mail: mail@scitech.se
Telephone: +46-706868081