 Improve Your Visual Studio Debugging Experience with .NET Memory Profiler
Start profiling, open session files, and get additional memory information while debugging, directly from Visual Studio. .NET Memory Profiler is fully integrated with Visual Studio, so you never have to leave your development environment.
With .NET Memory Profiler Visual Studio integration you can:
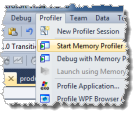
Simply select the Start memory profiler command, and .NET Memory Profiler will build your project and start profiling. View real-time memory usage, collect snapshots and quickly switch between source code and memory usage information.
If the start-up project is an Azure project, the profiler will start profiling the Azure compute emulator and its related processes.
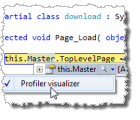
You can debug and profile the memory usage at the same time. Snapshots can be collected while stopped at a breakpoint. Use the profiler visualizer from a watch window and get access to all the information you might need about an instance, such as a full instance graph and the allocation call stack. (more...)
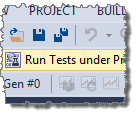
By using the "Run unit tests under profiler" command in Visual Studio, you can now easily run your unit tests under the profiler. (more...)
.NET Memory Profiler can be integerated into Visual Studio. Download the free trial to see how it can help you with your memory issues directly from Visual Studio and improve your debugging experience.
Download Free Trial
© Copyright 2001-2023. SciTech Software AB
All rights reserved.
SciTech Software AB
Ynglingavägen 1-3
SE-177 57 Järfälla
Sweden
E-mail: mail@scitech.se
Telephone: +46-706868081